Skip to content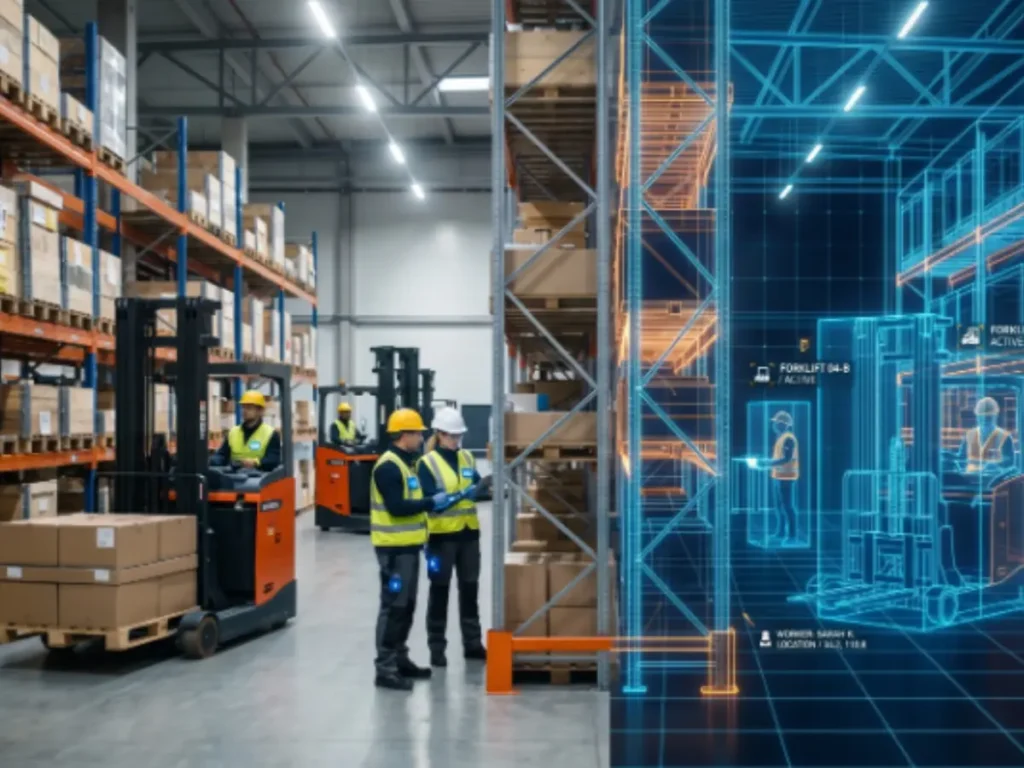
Warehouse efficiency metrics are not a matter of debate. They are specified, benchmarked and, on the safety side, mandated, and any competent operation is already reporting most of them. What varies enormously between facilities is not which measures they track but how faithfully those measures reflect what actually happened on the floor.
The operational reference is the Warehousing Education and Research Council, whose annual DC Measures study benchmarks roughly fifty metrics across seven categories. One of those categories is employee and safety performance, sitting alongside operational, financial and capacity measures rather than beneath them. That placement is worth noting, because it reflects how facilities are assessed externally even where internal reporting keeps the two apart.
The integration question usually determines whether any of this reaches a report, and a location intelligence layer contributes on two levels. The first is enrichment of what you already run.
The Digital Twin exposes its derived quantities through an API and returns them where they are already consumed: travel and dwell into the labor management or WMS reporting that produces picking productivity, staging dwell into receiving reports, and observed convergence events into the EHS system holding the near-miss register.
The KPI names on the monthly report do not change. What changes is the fidelity of the figures beneath them, and the fact that a weak number can be traced to a location, a shift and a truck.
The second level is analysis those systems are not designed to perform.
Enterprise reporting is necessarily generic, whereas the Digital Twin's own dashboards are purpose-built for warehouse operations and work against the complete location history rather than the summary fields an integration passes along. That difference supports interrogation a WMS report cannot reach: congestion heat maps by hour of shift, route comparisons between crews, dwell distributions per staging lane, and interaction density at named intersections. Because these views are configured rather than developed, they can be reshaped as conditions change, which matters in a facility where layout, order profile and shift patterns are rarely settled for long.
The practical result is that the metrics you report become more accurate, while the questions you are able to ask about them become considerably more specific.
One caveat is worth stating plainly, because it determines whether the exercise works at all. Accuracy is a function of design: the sensing mix has to suit the building, and a poorly specified deployment produces confident numbers that are wrong, which is worse than no numbers.
The sensible entry point is a single zone where losses are suspected but unproven, validated across a full production week rather than a demonstration, with the integration into the existing system proven in that same zone before any wider rollout. We would generally rather walk the floor and identify the two KPIs most likely to move than specify a platform before that question is answered. A deployment reporting both throughput and safety outcomes is documented in our warehouse forklift tracking case study.
Warehouse Metrics Are Settled but the Capture Is Not
Picking productivity, dock-to-stock time and near-miss frequency are already defined, benchmarked and on your monthly report. The question worth asking is how accurately they are being captured, and how much further each one can be optimized once precise location of assets, inventory and people is measured directly and fed back into the systems you already run.⎯ Key Takeaway
The metrics are not the problem. WERC, OSHA and BLS already define them and most warehouses already report them. The constraint is capture: a WMS registers transactions and an incident log registers outcomes, so neither sees the movement in between. Continuous location data closes that gap, resolving each figure to the aisle, shift and truck that produced it, and it does so as an enrichment to the WMS, labor and EHS systems already in place rather than as a replacement for them.
On the safety side the definitions are regulatory. What constitutes a recordable case is fixed by OSHA's injury and illness recordkeeping rules, and industry rates are published through the BLS Survey of Occupational Injuries and Illnesses. Both rely on the same normalization: an event count multiplied by 200,000, divided by hours worked, where the constant represents one hundred full-time employees over a working year. The convention is what makes one site comparable to a sector, and it applies to leading indicators just as cleanly as to lagging ones. So the interesting question is not which warehouse efficiency metrics to adopt. It is why two facilities reporting the same picking productivity figure can be running very differently, and the answer usually lies in what the source systems were never designed to observe.What Real-time Location Data Adds
A warehouse management system records transactions. It registers that an order was picked at 10:42 by a given operator, but not the route driven to reach it, the time spent queued at a cross-aisle, or how many pedestrians passed within two meters during the approach. An incident log records outcomes, after the fact and only when someone files. Both systems are doing their job; location data simply falls outside what either was built to observe, and it is the input a substantial share of warehouse efficiency metrics quietly depend on. A location intelligence layer supplies it directly: continuous location of people, trucks and inventory, from which travel, dwell, congestion and interaction are derived. Two things follow. The first is resolution. A monthly productivity average becomes a figure attributable to a specific aisle, shift and truck, which is the difference between knowing a number moved and knowing why. The second is that these four derived quantities do not belong to a single domain. Travel and dwell read as productivity, congestion and interaction read as exposure, and both are computed from one data stream, which is why instrumenting movement for throughput reasons also instruments a large part of safety measurement. Read this forklift safety technology guide for more detailed insights. None of this displaces the WMS. The Digital Twin ingests position, derives the quantities, and returns them to the systems that own the reporting, so the picking productivity figure your labor management system already produces arrives with its travel component separated out. Figure 01 sets out the relationship.Productivity KPIs Location Data Sharpens
Five operational KPIs gain materially once movement is measured directly. Each is an established WERC metric that most facilities already report, and in each case location data changes what the number contains rather than simply delivering it faster. That distinction is the one to apply to any technology claim about warehouse efficiency metrics: quicker reporting of an unchanged figure is a dashboard improvement, while a more faithful figure is a measurement improvement. Travel per pick is the clearest case, because outside a location layer it is not measured at all, only estimated from layout assumptions. Expressed as distance or time per line, it isolates the unproductive portion of picking labor and is the metric that most often justifies re-slotting or route redesign. Picking productivity, conventionally lines per labor hour, gains precision for the same reason: decomposing the hour into travel, search and handling explains why a rate moved, which the aggregate figure never does. Dock-to-stock time covers receipt through to a pickable location, and the staging dwell inside it is usually the largest and least visible component. Location data attributes the delay to a specific staging area and shift rather than to receiving as a whole, and it extends naturally to trailer and door activity, as our work on dock and yard management covers. Asset utilization is the fourth: the proportion of available truck hours spent in productive motion rather than idle, queued or searching. We have set out what fleet-level instrumentation exposes in a related piece on forklift fleet tracking. Order cycle time is the fifth, and it benefits less as a headline figure than as a decomposition. The elapsed interval from receipt to dispatch is straightforward to obtain from a WMS, but attributing it to specific stages is not, and the queueing that occurs between recorded transactions is invisible to the system that produced them. Location data assigns the interval to real places, which converts a slow order cycle from a departmental question into a bounded one. Inventory accuracy completes the set. The recorded count belongs to the WMS, but continuous location for tracked items turns a periodic audit into a live reconciliation, flagging a discrepancy when stock moves rather than at the next cycle count, an approach we examine under real-time inventory tracking.Safety KPIs Location Data Sharpens
This is where better capture changes a KPI's character rather than its precision, and it is the stronger half of the argument. Consider what a conventional near-miss program actually records. An event is captured only if a person recognizes it, judges it reportable, and files. The resulting rate therefore measures reporting behavior at least as much as it measures risk, which is why it tends to fall during busy periods, precisely when exposure is rising. The metric is sound; the collection method undermines it. A location layer replaces self-reporting with observation. Near-miss frequency, calculated as near misses multiplied by 200,000 over hours worked, becomes a count of every convergence meeting a defined threshold, logged automatically with position and timestamp. The same threshold logic yields the truck and pedestrian interaction rate, a direct exposure measure with no equivalent in a conventional program, and zone speed compliance, which registers actual speeds in designated areas rather than the presence of a sign. Together these convert leading indicators from an expression of reporting culture into an operational reading, and they localize risk to specific intersections and hours. The enforcement questions that follow are addressed in our guide to forklift safety rules in warehouse operations.See the KPIs you already report rebuilt from live location data and fed back into your existing systems.
Book a live demo → The financial case for treating these as efficiency measures is well documented. Liberty Mutual's 2025 Workplace Safety Index places the cost of serious workplace injuries in the US at 58.78 billion dollars annually, with overexertion involving outside sources the largest single category at 13.7 billion and same-level falls next at 10.5 billion. Both are movement injuries, generated by how people and loads traverse a building. OSHA's Safety Pays methodology adds a counterintuitive detail: indirect costs run from roughly 1.1 times direct costs on the most expensive claims to 4.5 times on the cheapest, so the minor incidents that never reach an executive review carry the highest hidden multiple. Read alongside the productivity side, this is the argument for keeping safety within the same set of warehouse efficiency metrics rather than in a parallel compliance report: the exposure being measured is generated by the same movement that determines throughput, and it carries a cost that behaves like any other operating loss.Integrating RTLS With the Systems You Already Run
The following table summarizes the warehouse efficiency metrics covered here, the body that defines each, and what better capture contributes.| KPI | Convention | Defined or Benchmarked By | What Location Data Contributes |
|---|---|---|---|
| Productivity | |||
| Travel per Pick | Distance or time ÷ lines | WERC operational category | Without it, this can only be estimated from layout assumptions |
| Picking Productivity | Lines ÷ labor hours | WERC DC Measures | Splits the labor hour into travel, search and handling |
| Dock-to-Stock Time | Put-away complete − receipt | WERC DC Measures | Isolates staging dwell by area and by shift |
| Asset Utilization | Productive motion ÷ available hours | WERC capacity category | Distinguishes idle, queued and searching time |
| Order Cycle Time | Dispatch − order receipt | WERC customer category | Assigns the elapsed time to actual stages |
| Inventory Accuracy | (Matching locations ÷ counted) × 100 | WERC quality category | Reconciles continuously rather than at the next count |
| Safety | |||
| Near-Miss Frequency | (Near misses × 200,000) ÷ hours | OSHA rate convention | Logs every qualifying event without relying on reports |
Interaction Rate | (Convergence events × 200,000) ÷ hours | OSHA rate convention, site-applied | Produces an exposure measure manual reporting cannot supply |
| Zone Speed Compliance | Compliant transits ÷ total transits | Site traffic rules | Records actual speeds rather than posted limits |
| Exposure by Zone | Events per zone per hour | Site-defined, no external standard | Pinpoints risk to named intersections and shifts |