Executive Summary
The capacity hiding around your line.
Production line efficiency improvement programs typically plateau because they only measure what their machines are doing. The remaining capacity sits in the logistics layer that surrounds the line — material flow, forklift utilization, operator movement, and the conflicts between them.
This guide explains how an RTLS Digital Twin makes that layer visible, why three of the seven lean wastes go undetected without it, and the structured path to capturing the next 10 to 20 percent of throughput.
Inside the Article
Introduction
Production line efficiency improvement is usually framed as a machine problem. Improve uptime. Reduce changeover. Track OEE. That work matters, but it has a ceiling — and most plants reach it sooner than they expect.
The bigger lever sits outside the machine envelope, in the logistics that surround the line. Material that arrives late, forklifts and tuggers running empty most of the time, operators walking too far for parts or crossing vehicle pathways. None of it shows up on your MES, because your MES does not track where things are — only what they are doing once they get there.
This is where Real-Time Location Systems (RTLS), combined with a Digital Twin, become valuable. An RTLS Digital Twin captures the spatial layer of your plant — every forklift, tugger, AMR, WIP, and associate — and turns it into measurable flow data. That visibility is what unlocks the next stage of efficiency, especially in plants already running disciplined lean and OEE programs.
This guide covers the logistics blindspots most operations teams miss, how the seven wastes of lean manufacturing map to physical movement, and what an RTLS Digital Twin exposes that machine monitoring cannot. A practical view of the layer most efficiency programs forget to instrument.
01 · The Blind Spot
Where Production Line Efficiency Improvement Actually Lives
Walk through any plant during a working shift and the pattern is familiar. The machines run and the dashboards and KPIs on screens look fine. The supervisor still has a list of unresolved problems by lunchtime.
The reason is simple. Machine monitoring captures what equipment is doing. It does not capture what happens in between equipment. That is where the loss accumulates — in transport, in waiting, in motion, in queues that build up because a forklift is still three aisles away with the wrong load.
McKinsey’s research on factory digital twins makes the point directly. In one metal-fabrication case, the team cut total processing time by minimising blocked and starved time at the bottleneck — not by speeding up the bottleneck itself. The fix was upstream and downstream of the constraint, in the flow between stations.
Flow is a spatial property. If your data has no spatial dimension, you cannot see flow.
You can only see the symptoms — missed takt, late deliveries, supervisors firefighting between stations. An RTLS Digital Twin adds the dimension that machine data is missing.
02 · The Seven Wastes
The Seven Wastes Through a Logistics Lens
Taiichi Ohno’s seven wastes of lean manufacturing are usually taught as a process checklist. But five of them describe the physical movement of things in space.
SPATIAL
Transport
Moving material around. Pure cost — the customer never pays for it.
SPATIAL
Motion
Operators walking, reaching, searching. Visible only with positioning data.
SPATIAL
Waiting
Idle stations starved of input. Often a transport problem in disguise.
SPATIAL
Inventory
WIP and buffers. Mass and location both matter; only one is usually tracked.
SPATIAL
Overproduction
Building ahead of demand. Shows up spatially as accumulating WIP.
PROCESS
Overprocessing
Adding more value than the customer pays for. Process design issue.
QUALITY
Defects
Rework and scrap. Caught by quality systems, not location systems.
HUMAN
Skills (8th)
Underused human capability. Solved by training, not data.
Transport, Motion, Waiting, Inventory, and Overproduction are all where, when, and how-fast problems. They leave footprints in the logistics layer. A traditional MES has no clean answer for any of them, because it watches machines, not aisles. This is also why so much of lean’s hardest work — value stream mapping, kaizen events, 5S — still relies on paper, stopwatches, and walk-around observation.
03 · The Sensing Layer
How an RTLS Digital Twin Improves Production Line Optimization
An RTLS Digital Twin combines two layers. The Real-Time Location System captures position, motion, and dwell across your facility — UWB tags on tools and assets, BLE beacons on bins and racks, SLAM-based vision on forklifts and AGVs. The Digital Twin then synthesizes that spatial data alongside your machine and process data into a live operational model. The technology mix varies; the output is consistent — every relevant object in your plant becomes a moving point with a timestamp, integrated into one decision surface.
The machine layer
- •Equipment uptime and downtime
- •Cycle time at each machine
- •Throughput per station
- •Quality and yield rates
- •Scheduled maintenance status
The logistics layer
- ›Material wait time at the station
- ›Forklift routes and load factor
- ›Operator walking distance
- ›WIP dwell time between stations
- ›Pedestrian-vehicle interactions
Together, these two layers answer questions every continuous improvement team has been asking since the 1980s. Where does work-in-process actually wait, and for how long? Which routes do forklifts run, and how full are they on each leg? How far do operators walk per shift, and which zones do they revisit? Academic research on RTLS in production confirms what we see in the field: this is the layer where most production line efficiency improvement programs find their next 10 to 20 percent of throughput, after machine-level OEE has been pushed as far as it can go.
04 · The Three Blindspots
Three Logistics Blindspots in Assembly Line Efficiency
Across deployments, three logistics blindspots come up again and again. Each looks like a different problem on the surface. All three are spatial. All three are invisible to standard machine monitoring.
01
Material wait time at the station
Station starved — MES sees nothing wrong
02
Fleet utilization & routing
Empty runs, oversized fleets, mixed vehicles
03
Pedestrian-vehicle interactions
Near-misses that delay line-side delivery
Material wait time at the station
A workstation idle while it waits for parts is a station running below cycle target — but the loss never registers anywhere visible until it’s too late. The machine is not broken and the operator is at their post: the MES sees nothing wrong. The only signal is a slowly building backlog two stations downstream. An RTLS Digital Twin tracks bins, kits, and pallets and makes wait time directly measurable. Once visible, the fix is almost always logistical, not mechanical: change the kanban trigger, reroute the forklift, restage the buffer. No new equipment required.
Forklift fleet utilization
Most plants run their fleets larger than what is actually needed. The reason is structural; nobody is measuring loaded versus empty trips per shift, route compliance or vehicle downtime in real-time so fleet sizing tends to grow conservatively year over year – especially for mixed fleets. An RTLS Digital Twin turns utilization into a daily KPI. Plants routinely shrink their active fleet by one to three trucks within a quarter of deploying location-aware telematics. Throughput holds and operating cost drops. The system tends to pay for itself in under twelve months on this lever alone.
Pedestrian-vehicle interactions
Every near-miss is also a stop. Forklifts brake, operators step aside and the line-side delivery is delayed a few seconds while everyone resumes. Each incident is small. In aggregate across a shift, they cost real production time — and the safety record that goes with them. RTLS Digital Twin proximity warning and active intervention systems reduce both incidents and the unplanned stoppages that follow. The productivity case is often stronger than the safety case, even though most projects start with safety as the primary justification.
05 · The Path Forward
How to Start Manufacturing Line Optimization
Do not try to instrument the whole plant on day one. Successful deployments follow a tight path. If you are wondering how to improve production line efficiency without a large capital programme, this is the sequence we recommend.
Pick one line
Usually the bottleneck line, sometimes the highest-mix line. Tight scope is your friend.
Define one before-and-after KPI
Forklift moves per hour. Operator walking distance. Material wait time at the constraint. One number to defend.
Run a 30 to 60-day pilot
Long enough to see real shift-to-shift variation. Short enough to stay accountable to outcomes.
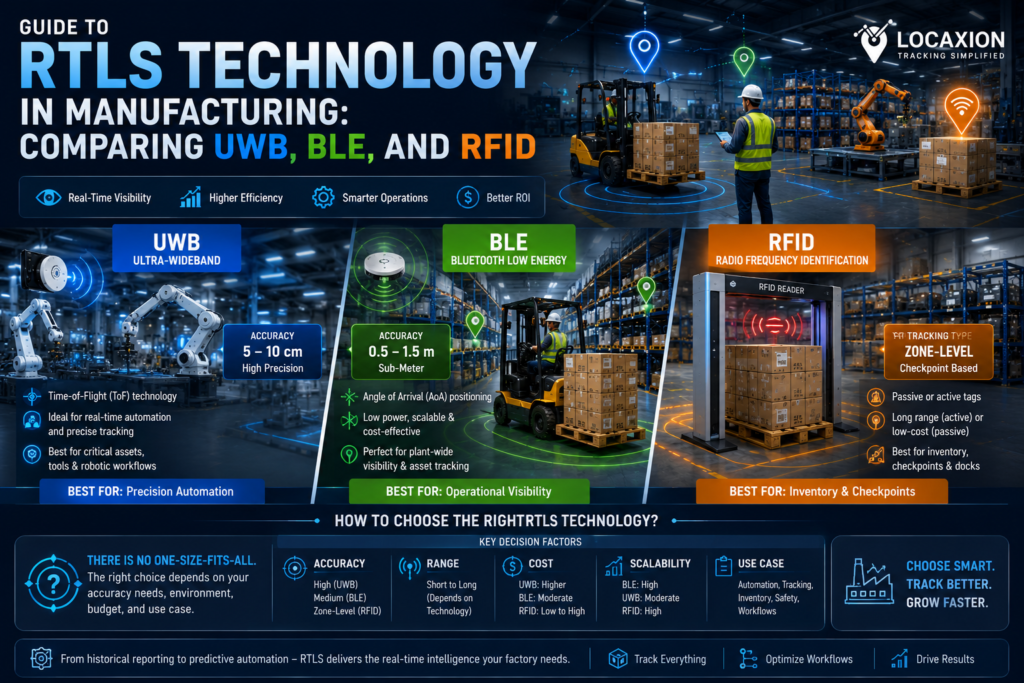
Match technology to the use case
UWB for precision-critical zones. BLE for broad coverage. SLAM for mobile fleets. Hybrid almost always beats single-technology rollouts.
Synthesize in a Digital Twin once the data is real
Not before. A twin without live spatial data is decoration.
Run what-if scenarios and optimize
With the twin running on live data, simulate layout changes, schedule adjustments, and fleet resizing against real movement patterns. Test interventions in the model before changing anything on the floor — risk-free experimentation against your actual production environment.
FAQs about Production Line Efficiency in Manufacturing
How do I improve production line efficiency without replacing equipment?
Most plants find more capacity in their logistics than they ever find in their machines. An RTLS Digital Twin makes material wait time, forklift utilization, and operator paths measurable. Improvements typically come from rerouting, rescheduling, and redeploying mobile assets — not new equipment. This is what modern production line efficiency improvement programs look like in practice.
What is an RTLS Digital Twin and how does it support assembly line efficiency?
An RTLS Digital Twin is a sensing and synthesis layer that tracks materials, mobile assets, and people in real time and integrates that data into a live operational model. For assembly line efficiency, it exposes the hidden delays between stations: late material delivery, excessive operator walking, conveyor backups. That visibility is what makes lean improvement work in environments where stopwatches and clipboards no longer scale.
How does production line optimization differ from improving OEE?
OEE measures what your equipment is doing. Production line efficiency improvement is broader. It covers everything around your equipment — logistics, mobile assets, people movement. Most plants plateau at 75 to 80 percent OEE; the remaining gains live in the logistics layer, where production line optimization actually happens.
Where do most logistics blindspots occur on a production line?
In three places: between staging and the workstation (material wait time), inside the forklift fleet (utilization and routing), and at every pedestrian-vehicle interaction (near-misses that turn into stoppages). All three are invisible to standard MES platforms and visible to an RTLS Digital Twin.
How to improve assembly line efficiency in a high-mix environment?
High-mix lines suffer most from logistics variability — different products need different parts, different routes, different cycle times. An RTLS Digital Twin captures that variability directly and lets you model schedule changes against real movement data, which is what assembly line optimization in a high-mix setting actually requires.
How long does an RTLS Digital Twin pilot take to show results?
A focused 30 to 60-day pilot on a single line is usually enough to baseline current performance and document the first two or three quantified improvements. Full-plant rollouts typically take 6 to 12 months. Phased deployments deliver value at each stage rather than waiting for full integration.