 Skip to content
Founded on the Expertise of 100+ Pioneering RTLS Projects Since 2008
RTLS & Digital Twins
in
Logistics
LocaXion Designs and Deploys Vendor-Agnostic RTLS Digital Twins
that Go Beyond Forklift Tracking to Deliver ROI.
The LocaXion Multi-Tech Advantage
We intelligently combine UWB, BLE, Vision, WiFi, and RFID based on your goals and specific outcomes.
Why vendor-agnostic matters in logistics: RTLS for Logistics allows you to tTrack high-value assets with UWB precision (30cm accuracy), monitor pallets with BLE efficiency (5-year battery life), manage yard assets with GPS/GNSS outdoor positioning, and leverage existing WiFi infrastructure for forklift tracking, all within a single unified platform.
This hybrid approach delivers 35 to 50% better ROI than single-technology solutions because you're not forcing every use case into the same technology box. Indoor UWB for warehouse precision, outdoor GPS for yard management, BLE for cost-effective pallet tracking, and RFID for high-speed dock door reads, each optimized for its specific application.
Core Applications
We deliver four core logistics RTLS solutions that cut search time and boost efficiency.
Dock & Yard Management
Track every trailer in real time to eliminate detention fees and cut dock-to-stock time by 40%.
See SolutionAGV Fleet Management
Prevent AGV traffic conflicts 15 seconds in advance and boost utilization from 65% to 82%.
See Solution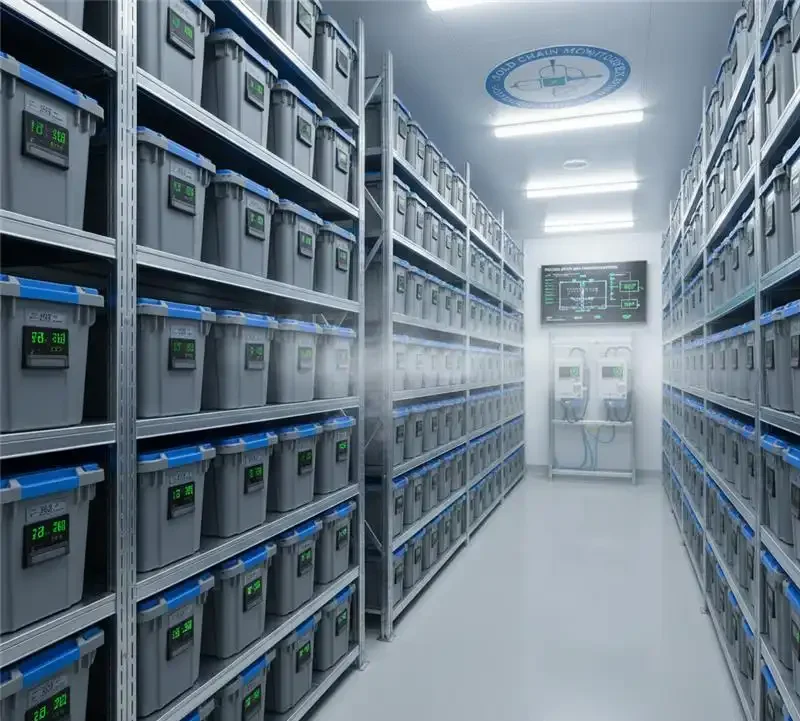
Cold Chain Monitoring
Receive geofenced alerts before cargo enters the wrong zones to prevent spoilage and violations instantly.
See SolutionForklift Tracking System
Expose 28% idle time and right-size your fleet to save $85K to $120K annually.
See SolutionTrack & Find is just the beginning. Now let's explore how we combine RTLS with digital twin technology to
not just locate assets, but measure and optimize your entire logistics operation through advanced analytics
and process intelligence.
Knowing a forklift's location is just the beginning. Knowing it traveled 2.3 miles empty yesterday makes it actionable. Discovering that your slotting strategy causes 40% unnecessary travel makes it transformative.
The CORE APPLICATIONS above give you visibility. The ADVANCED APPLICATIONS below give you intelligence: Measuring performance, identifying constraints, predicting problems, and automating optimization.
Backed by 15 years of logistics expertise, we do more than deploy sensors. We design connected digital ecosystems that merge RTLS data with WMS, TMS, and ERP systems to create a living operational model of your facility.
Advanced Applications
We transform RTLS data into measurable insights that optimize logistics operations.
Dynamic Task Assignment
Routes tasks to the nearest available resource using real-time location
Deep Dive →Compliance Automation
Automatically logs location, temperature, and activity data to ensure full compliance
Deep Dive →Bottleneck Analysis
Runs your operation under peak load to measure where queues form and utilization maxes out
Deep Dive →Throughput Heatmapping
The Slotting Assumption Problem
Most facilities slot inventory using ABC velocity analysis, placing fast movers near shipping and slow movers farther away. However, ABC analysis does not account for pick density, order profiles, or cross-functional traffic. Heatmaps reveal the truth: your so-called optimized slotting may create congestion in aisles 12 to 15 while aisles 3 to 7 sit empty. Pickers end up traveling 40% farther than necessary because high-velocity SKUs are scattered across zones.
What Heatmaps Reveal
- Congestion zones: Areas where MHE dwell time exceeds 45 seconds, signaling traffic conflicts or processing bottlenecks.
- Dead zones: Expensive space with less than 5% utilization, often ideal for reslotting or repurposing.
- Travel inefficiency: Picker path heatmaps showing unnecessary cross-facility travel caused by poor slotting.
- Dock imbalance: Uneven utilization across dock doors, with some overloaded and others underused.
- Shift variance: Activity patterns that vary sharply between shifts, revealing staffing or process inconsistencies.
Actionable Outcomes
A 450k sq ft distribution center found through heatmapping that 78% of picks occurred in just 22% of pick locations. They reslotted high-velocity SKUs into a dense golden zone, reducing average pick travel from 180 feet to 65 feet, a 64% reduction. This improvement added 2.1 lines per labor hour and generated $340,000 in annual labor savings. Another client discovered their returns processing area was causing peak-hour congestion; relocating it to an underused zone increased throughput by 18%.
Dwell Time Analytics
Dwell time is the silent killer of logistics efficiency. It is the time assets spend stationary between process steps such as trailers waiting for dock doors, pallets sitting in receiving, or inventory staged for outbound. While your WMS tracks transactions, it does not capture the idle gaps between them. RTLS closes this gap by measuring actual dwell time with minute-level precision.
The Working Capital Problem
A 500k sq ft distribution center processing $180 million in annual inventory typically has $8 to $12 million in working capital sitting idle at any given time. This includes pallets received but not put away, inventory picked but not staged, and trailers loaded but not departed. If the average dwell time drops from 3.5 hours to 2.1 hours (a 40% improvement), it can free up $3.2 to $4.8 million in working capital. At an 8% cost of capital, that equals $256,000 to $384,000 in annual savings from dwell time reduction alone.
What Dwell Analytics Measure
- Receiving dwell: Time from trailer unload to putaway completion, often revealing that receiving is understaffed or putaway is batched inefficiently.
- Staging dwell: Time inventory sits in outbound staging before loading, indicating wave timing issues or inconsistent carrier arrivals.
- Trailer dwell: Time trailers occupy dock doors or yard spots, a direct driver of detention fees and dock capacity constraints.
- MHE idle time: Time forklifts remain stationary between tasks, revealing over-fleeting or inefficient task assignments.
- Cross-dock dwell: Time between inbound receipt and outbound shipment, critical for cross-dock operations targeting sub-four-hour turnaround.
Actionable Interventions
A food distributor discovered an average trailer at dwell time of 3.8 hours, with 22% of trailers exceeding the two-hour free window, costing $180,000 annually in detention fees. RTLS-triggered alerts at 90 minutes enabled proactive action, reducing average dwell to 1.6 hours and eliminating 94% of detention costs. Another client found inbound pallets sat in receiving for 4.2 hours on average. After implementing real-time dwell alerts and dynamic putaway prioritization, they reduced receiving dwell to 1.8 hours and freed $2.1 million in working capital.
Utilization Metrics
Utilization measures the ratio of productive time to available time. For material handling equipment (MHE), it compares operating hours to shift hours. For dock doors, it tracks occupied time versus total operating hours. For AGVs, it measures task time against overall fleet availability. Many facilities overestimate utilization because they lack continuous tracking. They see equipment in use and assume it is always productive, but RTLS data often reveals the real picture.
The Over-Fleeting Problem
A typical 300,000 sq ft distribution center operates 40 to 50 forklifts. At $35,000 per unit plus $8,000 annual maintenance, that equals $1.75 million in capital and $400,000 in annual operating costs. However, continuous tracking often shows actual utilization is only 55 to 60%, meaning 16 to 20 forklifts sit idle most of the time. This happens because fleets are sized for peak demand, not average demand. Without utilization data, it is impossible to know whether more equipment is needed or if the existing fleet is being used inefficiently.
What Utilization Metrics Reveal
- MHE utilization: The percentage of shift time forklifts actively move loads versus sitting idle or traveling empty, usually 55 to 65%, indicating over-fleeting.
- Dock door utilization: The percentage of operating hours doors are occupied by trailers, often 60 to 70%, showing available capacity for future growth.
- AGV/AMR utilization: The percentage of time autonomous vehicles perform tasks versus idling or charging, typically 65 to 75%, below the 85% target.
- Operator productivity: Loads moved per operating hour by individual operators, revealing 30 to 40% variance between top and bottom performers.
- Zone utilization: The percentage of time each area of the facility is actively used versus idle, helping identify underutilized space.
Right-Sizing Outcomes
A 400k sq ft distribution center tracked 48 forklifts over 90 days and found average utilization at just 58%. They discovered operations could run efficiently with 38 to 40 forklifts instead of 48. By reducing the fleet to 42 units (keeping a small buffer), they saved $210,000 in capital costs and $48,000 annually in maintenance. Another client used utilization data to justify adding only four dock doors instead of eight. The data showed existing doors were 68% utilized, and better scheduling could handle the growth, saving $320,000 in construction costs.
Geofence Automation
Geofences are virtual boundaries overlaid on your physical facility. When an asset crosses a geofence boundary, the system triggers predefined actions such as alerts, workflow automation, data logging, or equipment control. This transforms RTLS from a passive tracking system into an active automation platform that responds to location events in real time without human intervention.
The Manual Monitoring Problem
Traditional operations rely on manual monitoring. Someone watches for trailers arriving, someone checks if pallets are staged, and someone verifies that forklifts are not speeding in pedestrian zones. This process is expensive, prone to errors, and difficult to scale. Geofence automation eliminates manual monitoring by making the system the observer. It never blinks, never misses an event, and responds instantly.
Common Geofence Applications
- Yard check-in automation: Trailer crosses yard entry geofence → system auto-creates receiving appointment, assigns dock door, notifies receiving team.
- Dwell time escalation: Asset remains in staging geofence for 45 minutes → system escalates alert to supervisor, flags potential bottleneck.
- Safety zone enforcement: Forklift enters pedestrian zone geofence → speed limiter activates, audible alarm sounds, incident logged.
- Temperature zone compliance: Cold chain pallet exits refrigerated geofence → timer starts, alert triggers if pallet doesn't return within 12 minutes.
- Cross-dock automation: Inbound pallet enters cross-dock geofence → WMS auto-assigns to outbound order, directs to staging location.
- Inventory cycle count triggers: High-value asset exits secure geofence → system logs movement, triggers cycle count verification.
Real-World Impact
A 3PL implemented yard geofence automation that completely eliminated manual check-in processes. When a trailer entered the yard geofence, the system read the RFID tag, matched it to the appointment, assigned a dock door based on contents and availability, and sent the driver a text with the door assignment, all in under 8 seconds. This reduced check-in time from 6 to 8 minutes to under 30 seconds and eliminated two FTEs previously assigned to yard management. Another client used staging geofences to automatically escalate pallets left for more than 45 minutes, reducing average staging dwell from 2.8 hours to 1.1 hours
Dynamic Task Assignment
Traditional WMS task assignments are static. Tasks are assigned to zones or operators based on predefined rules, regardless of where equipment or people actually are at that moment. This creates inefficiency because a forklift in aisle 3 might get assigned a putaway task in aisle 18 while another forklift in aisle 17 sits idle. Dynamic task assignment uses real-time location data to route tasks to the nearest available resource, minimizing travel, and maximizing throughput.
The Static Assignment Problem
Most WMS systems assign tasks based on operator login location or zone assignment. For example, if you are logged into Zone A, you receive Zone A tasks. However, operators and equipment move constantly. By the time a task is assigned, the operator may be 200 feet away, while another operator only 20 feet from the task remains idle. This causes unnecessary travel, and studies show that 25 to 35% of forklift travel is empty movement between task locations.
How Dynamic Assignment Works
- Proximity-based routing: When a putaway task is created, the system calculates the distance from all available forklifts and assigns it to the nearest one, reducing travel by 30 to 40%.
- Predictive task batching: The system analyzes upcoming tasks and current equipment positions to create optimal task sequences that minimize travel distance.
- Load balancing: The system monitors task completion rates and redistributes work to prevent some operators from being overloaded while others are idle.
- Skill-based routing: The system considers both proximity and operator certification, assigning hazmat tasks only to certified operators while still optimizing distance.
- Interleaving optimization: The system assigns putaway and retrieval tasks in sequence to minimize empty travel, allowing forklifts to drop off a pallet and immediately pick up another nearby.
Measurable Outcomes
A 500,000 sq ft distribution center implemented dynamic task assignments and reduced average travel per task from 240 feet to 155 feet, a 35% reduction. This led to 2.8 additional tasks per labor hour and an 18% increase in throughput without adding headcount. Another client used dynamic assignments to remove zone-based restrictions entirely. Operators now work across the facility, and the system routes tasks purely by proximity, increasing labor utilization from 68% to 84% and reducing overtime costs by $180,000 annually.
Compliance Automation
Regulatory compliance in logistics is a documentation challenge. FSMA requires temperature logs for cold chains, OSHA demands forklift safety audits, DOT mandates yard management records, and the FDA requires traceability for pharmaceuticals. Manual compliance is costly, error-prone, and increases audit risk. RTLS automates compliance by continuously logging location, environmental conditions, and equipment behavior, generating complete audit trails without human effort.
The Manual Compliance Problem
Traditional compliance depends on manual record-keeping. Someone logs trailer arrival times, someone records temperature checks, and someone documents forklift inspections. This creates three major issues:
(1) it is expensive, as compliance documentation consumes 8 to 12% of administrative labor,
(2) it is incomplete, since manual logs often have gaps, and
(3) it is risky, as incomplete records expose companies to audits and fines.
Automated Compliance Applications
- FSMA cold chain compliance: System logs temperature and location for every pallet continuously, generates temperature excursion reports automatically, and maintains full chain-of-custody documentation.
- OSHA forklift safety: System tracks forklift speed in pedestrian zones, logs operator certifications, documents pre-shift inspections, and automatically generates safety incident reports.
- DOT yard management: System records trailer arrival and departure times, tracks dwell time, logs driver check-in and check-out, and maintains complete yard activity records.
- FDA pharmaceutical traceability: System continuously tracks pharmaceutical inventory, logs temperature exposure, maintains chain-of-custody records, and enables instant recall response.
- Hazmat handling compliance: System verifies only certified operators handle hazardous materials, logs storage duration and location, and documents proper segregation from incompatible materials.
Risk Reduction Outcomes
One pharmaceutical distributor faced $2.8 million in potential fines for incomplete cold chain documentation during an FDA audit. After implementing RTLS-based compliance automation that logs temperature and location for every pharmaceutical pallet continuously, they provided complete, timestamped records covering 18 months of operations and passed with zero findings. Another food distributor reduced compliance labor from 3.5 FTEs to 0.8 FTEs by automating FSMA documentation, saving $180,000 annually while improving audit readiness.
Digital Twin Modeling
A digital twin is a virtual replica of your physical facility that mirrors real-world operations in real time. It is not a static CAD model, but a living simulation powered by continuous RTLS data showing where every asset is, how each process performs, and where bottlenecks occur. This allows “what-if” analysis, so you can test operational changes virtually before implementing them physically.
The Capital Risk Problem
Facility modifications are expensive and often irreversible. Adding dock doors can cost $80,000 to $120,000 each, reslotting disrupts operations for weeks, and layout changes require months of planning. Yet most decisions are based on intuition or static analysis, such as “we think we need four more doors” or “we believe reslotting will help.” Digital twins remove this guesswork by simulating changes virtually and measuring predicted outcomes before committing capital.
What Digital Twins Enable
- Capacity planning: Simulate 20%, 30%, or 40% volume increases to identify breaking points, process failures, and necessary capacity investments.
- Layout optimization: Test different slotting strategies, pick path configurations, and staging locations virtually to measure the impact on travel distance and throughput before moving a single rack.
- Automation ROI analysis: Simulate adding AGVs, conveyors, or AS/RS systems to model throughput improvement, labor reduction, and payback period before selecting vendors.
- Process redesign: Test alternative workflows such as cross-docking versus putaway and picking, wave picking versus zone picking, and batch versus discrete order fulfillment to measure efficiency gains.
- Constraint identification: Run simulations under peak load to find bottlenecks such as receiving capacity, putaway speed, pick rate, or dock door availability that limit throughput.
Decision Confidence Outcomes
One retailer planned to add eight dock doors at a cost of $720,000 to handle projected volume growth. Digital twin simulation revealed the existing doors were only 68% utilized and the real constraint was receiving labor, not dock capacity. They added four dock doors instead of eight and increased receiving headcount, saving $360,000 while achieving the same throughput target. Another 3PL used digital twin modeling to test six different slotting strategies virtually. The winning strategy reduced average pick travel by 42% and increased lines per hour from 85 to 118, achieving a 39% productivity gain validated before implementation.
Scenario Planning
Scenario planning uses digital twin simulation to test multiple operational strategies in parallel, measuring the predicted outcomes of each approach. Instead of choosing between options based on intuition, you simulate each scenario, measure throughput, cost, labor requirements, and ROI, and then select the optimal strategy based on data. This is especially valuable for major strategic decisions with multi-year implications.
The Strategic Decision Problem
Major operational decisions have long-term consequences. Implementing wave picking requires WMS reconfiguration and process retraining. Adding AGVs is a multi-million dollar capital investment. Changing from putaway to cross-dock requires facility to redesign. Yet these decisions are often made based on vendor promises, industry trends, or executive intuition. Scenario planning replaces guesswork with simulation-based analysis.
Common Scenario Comparisons
- Picking strategy: Simulate wave picking, zone picking, or batch picking to measure lines per hour, labor needs, and order cycle time for each approach.
- Automation investment: Compare adding AGVs, hiring labor, or using a hybrid approach to model throughput, capital cost, operating cost, and payback period.
- Cross-dock vs. putaway: Simulate routing fast-moving SKUs directly to outbound versus traditional putaway and picking to measure dock-to-stock time, labor savings, and inventory accuracy.
- Slotting strategy: Test ABC velocity-based slotting, order profile-based slotting, or a hybrid approach to measure travel distance, pick density, and congestion.
- Shift configuration: Compare two-shift and three-shift operations to model throughput capacity, labor cost, overtime needs, and equipment utilization.
Data-Driven Decision Outcomes
One e-commerce fulfillment center was deciding between implementing wave picking or adding AGVs to improve throughput. Scenario planning simulated both options. Wave picking increased lines per hour from 85 to 112 at a cost of $180,000, while AGVs increased throughput to 128 lines per hour at a capital cost of $2.4 million. The simulation showed wave picking delivered 80% of the throughput gain at only 7.5% of the cost, making it the clear winner. Another 3PL compared two-shift and three-shift operations. Simulation showed that three shifts would increase capacity by 35% but reduce equipment utilization from 78% to 61%, making two shifts with overtime the more cost-effective choice.
Bottleneck Analysis
Every logistics operation has a constraint, the single process step that limits overall throughput. It might be receiving capacity, putaway speed, pick rate, or dock door availability. The problem is that most facilities cannot identify their constraint precisely because they lack visibility into process flow. Simulation-based bottleneck analysis runs your operation under peak load and measures where queues form, where dwell time spikes, and where utilization reaches maximum levels, pinpointing the exact constraint.
The Misallocated Investment Problem
Without bottleneck analysis, facilities often invest in the wrong capacity. You might add dock doors when the real constraint is putaway labor. You might hire pickers when the actual issue is receiving throughput. You might buy more forklifts when the constraint lies in WMS task assignment logic. These misplaced investments waste capital without improving throughput. The Theory of Constraints shows that only investments in the bottleneck improve system performance, while all others simply add unused capacity.
How Bottleneck Analysis Works
- Peak load simulation: Run the digital twin at 120 to 150% of current volume to stress-test the system and reveal which process fails first.
- Queue formation analysis: Measure where work-in-process accumulates. Long queues show that the upstream process is faster than the downstream process, identifying the bottleneck.
- Utilization mapping: Identify which resources reach 95 to 100% utilization, as these are likely constraining throughput.
- Dwell time spikes: Measure where assets sit idle the longest, indicating delays caused by constrained resources.
- Constraint validation: Simulate increasing capacity at the suspected bottleneck. If throughput improves, you have found the constraint; if not, reassess.
Targeted Investment Outcomes
One food distributor planned to add six dock doors at a cost of $540,000 to increase throughput. Bottleneck analysis revealed that dock doors were only 72% utilized and the real constraint was putaway labor, which was operating at 98% capacity during peak hours. They added four putaway employees at $160,000 annually instead of adding dock doors, increasing throughput by 28% at just 30% of the planned cost. Another retailer discovered its constraint was WMS wave release timing, not physical capacity. By adjusting wave release logic to balance workloads, they improved throughput by 15% with no additional capital investment.
Measure and Optimize helps you perform better today, but predictive intelligence prepares you for tomorrow.
Discover how RTLS and AI work together to keep your logistics one step ahead.
Knowing where inefficiencies occur is powerful. Knowing why they happen and what will happen next is transformational. Predictive intelligence turns every movement pattern, dwell time, and utilization metric into forward-looking insights that anticipate congestion, resource shortages, and maintenance needs before they impact production.
The INTELLIGENCE APPLICATIONS above optimizes in real time. The predictive applications below look ahead, forecasting workflow demand, automating scheduling, and enabling AI-driven decision support that keeps your operation one step ahead.
This is where domain expertise meets data science. We combine 15 years of RTLS and logistics experience with machine learning models that continuously learn from your facility's unique operational rhythms, ensuring every future move is smarter than the last.
Predictive Intelligence
We transform real-time logistics data into forward-looking insights that shape
smarter decisions for tomorrow.
Predictive Throughput Forecasting
Predict volume surges 6 to 12 hours early for proactive planning.
Deep DivePredictive Maintenance
Predict MHE failures 3 to 7 days in advance to prevent downtime.
Deep DiveDemand Sensing
Predict demand shifts early and position inventory proactively.
Deep DiveAnomaly Detection
Detect deviations in real time to prevent issues early.
Deep DiveLabor Optimization
AI replicates top-performer techniques and helps boost productivity.
Deep DiveInventory Optimization
AI reslotting cuts travel by 40% and boosts productivity.
Deep DivePredictive Throughput Forecasting
Predictive throughput forecasting uses machine learning to analyze historical patterns and predict future volumes 6 to 12 hours in advance. The models learn from 6 to 12 months of data, identifying trends by day of the week, customer, carrier behavior, seasonality, and even weather. This enables proactive labor scheduling, early bottleneck prevention, and capacity planning based on predicted demand rather than reactive decision-making.
The Reactive Staffing Problem
Most facilities operate reactively. A volume surge hits, and overtime is called in. A bottleneck appears, and teams scramble to clear it. A carrier arrives three hours early, and dock assignments are reshuffled. This reactive approach increases costs through overtime premiums, expedite fees, detention charges, and team fatigue. Predictive forecasting changes this by providing visibility up to eight hours in advance, allowing teams to schedule labor, pre-stage equipment, and adjust wave timing proactively.
What the Models Predict
- Inbound volume surges: Predict receiving volume 6 to 12 hours ahead based on carrier patterns, appointment schedules, and historical arrival data.
- Outbound order spikes: Forecast pick volume by analyzing order behavior, customer trends, and seasonality, enabling timely labor planning.
- Dock door demand: Predict which doors will be busiest based on inbound and outbound schedules, optimizing assignments before congestion occurs.
- MHE capacity requirements: Forecast forklift and AGV demand from expected throughput to ensure the right equipment is ready in advance.
- Bottleneck formation: Identify where queues are likely to form based on predicted volume and current resource availability.
Proactive Operations Outcomes
One 600,000 sq ft distribution center implemented predictive throughput forecasting and reduced overtime costs by 18% in the first 90 days. The system predicted a volume surge eight hours ahead, allowing the team to schedule six additional receiving staff at standard rates instead of calling in ten on overtime. Over 12 months, this saved $240,000 in labor costs. Another 3PL used forecasting to predict dock door demand and pre-assigned doors based on predicted volume, reducing trailer dwell time from 2.8 hours to 1.6 hours and saving $165,000 annually in detention fees.
Predictive Maintenance
Predictive maintenance uses IoT sensors and machine learning to forecast equipment failures before they occur. By analyzing patterns such as vibration, temperature, speed variation, idle time, and load cycles, the system detects early signs of potential failure. This allows maintenance to be scheduled during off-peak hours instead of reacting to unexpected breakdowns, reducing downtime and extending equipment life.
The Unplanned Downtime Problem
Unplanned equipment failures are costly, typically ranging from $1,200 to $2,800 per incident due to lost throughput, emergency repairs, and expedited parts. A 40-forklift fleet with 8 to 12 unexpected failures per month can lose $115,000 to $400,000 annually. These failures often happen during peak hours when downtime is most disruptive. Predictive maintenance enables proactive scheduling, so repairs are completed before breakdowns occur, preventing production delays and revenue loss.
What Predictive Maintenance Detects
- Bearing wear: Vibration sensors identify abnormal patterns up to a week before failure, allowing timely replacement.
- Hydraulic issues: Pressure sensors detect leaks or pump wear several days in advance, preventing major breakdowns.
- Battery degradation: Charge cycle data predicts declining capacity weeks before it impacts performance.
- Tire wear: Load distribution analysis reveals uneven wear that could lead to failure, prompting rotation or replacement.
- Motor overheating: Temperature sensors detect stress that signals potential burnout, enabling preventive action.
Downtime Reduction Outcomes
One 3PL with a 52-forklift fleet implemented predictive maintenance and reduced unplanned downtime from 11 incidents to 3 per month, a 73% decrease. This saved about $285,000 annually in lost throughput and repair costs. Scheduled maintenance during off-peak hours also eliminated workflow disruptions. Another food distributor extended forklift lifespan from 7.2 to 9.4 years, deferring $420,000 in replacement costs through better maintenance planning.
Demand Sensing
Demand sensing uses real-time operational data to predict demand shifts before they appear in sales reports. Traditional forecasting is backward-looking because it relies on past sales to project future trends. By the time sales data arrives, companies are already reacting. Demand sensing changes this by analyzing early signals such as inbound shipment patterns, inventory velocity, order backlog trends, and external factors like weather or events. This helps predict demand changes 2 to 4 weeks in advance.
The Forecast Lag Problem
Traditional demand forecasting has a 2–4 weeks lag: demand shifts, sales data reflects it 1–2 weeks later, the forecast updates another week later, then you react. By the time you adjust inventory positioning or labor planning, the demand shift is already 3–4 weeks old. This causes stockouts during surges and excess inventory during slowdowns. Demand sensing eliminates this lag by analyzing operational signals that precede sales.
Leading Indicators Analyzed
- Inbound shipment patterns: A sudden rise in inbound volume for specific SKUs indicates suppliers expect higher demand, allowing proactive inventory positioning.
- Inventory velocity changes: SKUs moving faster than usual show early demand growth, signaling when to restock before shortages occur.
- Order backlog trends: A growing backlog reveals demand outpacing supply, prompting capacity allocation and faster replenishment.
- Pick density shifts: Changes in pick frequency by zone or SKU highlight evolving demand patterns and support proactive reslotting.
- External signals: Weather data, events, and market trends provide additional context to anticipate demand fluctuations.
Proactive Planning Outcomes
One retailer used demand sensing to detect a 35% rise in outdoor furniture demand 2.5 weeks before it showed up in sales data. The early signal came from a sudden increase in inbound shipments from their supplier. They quickly moved inventory closer to high-demand regions and increased pick labor by 20%, preventing stockouts that could have cost $1.8 million in lost sales.
Another 3PL used demand sensing to predict a slowdown in automotive parts to demand three weeks in advance by tracking reduced inbound shipments. They adjusted labor schedules early, cutting costs by $95,000 and avoiding overstaffing during the slowdown.
Anomaly Detection
Anomaly detection uses machine learning to identify deviations from normal operational patterns. The system learns what normal looks like, such as typical forklift travel distance, expected dwell time, and standard throughput rates, then flags anomalies in real time. These anomalies often signal issues before they become visible, like a forming bottleneck, degrading equipment, or emerging inefficiency.
The Signal-to-Noise Problem
A 500k sq ft distribution center generates millions of location data points daily. Buried in this data are signals that matter. For example, a forklift traveling 2.8 miles when it should travel 1.6 miles indicates a slotting issue, a pallet sitting in staging for 3 hours when the average is 45 minutes signals a process delay, and throughput dropping 12% without a clear cause may point to an emerging bottleneck. Humans cannot monitor millions of data points, but anomaly detection does this automatically.
Anomalies That Matter
- Travel distance anomalies: A forklift traveling 40% more than the historical average indicates a slotting or task assignment issue.
- Dwell time anomalies: Assets sitting three times longer than usual signal a bottleneck or workflow breakdown that needs immediate attention.
- Throughput anomalies: A 15% drop in lines per hour without a volume change shows a constraint forming that should be resolved before it affects SLAs.
- Utilization anomalies: Equipment utilization dropping from 75% to 55% indicates task assignment inefficiency or demand imbalance.
- Pattern anomalies: Sudden shifts in traffic or zone usage suggest process or layout changes that need investigation.
Early Warning Outcomes
One food distributor’s anomaly detection system flagged a 22% increase in forklift travel distance in Zone 3 over a 48-hour period. Investigation showed that a WMS configuration error had changed putaway logic, sending forklifts to suboptimal locations. Fixing the error prevented an estimated $8,000 to $12,000 in daily efficiency loss. Another 3PL’s system detected a 14% throughput drop in receiving without volume change. The issue was traced to a new receiving clerk using an inefficient process, which was corrected through retraining within 4 hours instead of persisting for weeks.
Labor Optimization
Labor optimization uses RTLS data to measure individual operator productivity, identify performance variance, and recommend improvements. By tracking operator movement, task completion time, and travel patterns, the system reveals that top performers complete 30–40% more work than bottom performers, not because they work harder but because they work smarter. The system identifies what top performers do differently and recommends those techniques facility-wide.
The Productivity Variance Problem
In a typical 50-person picking operation, top performers complete 120 to 140 lines per hour while bottom performers complete 75 to 90 lines per hour, a 40-50% variance. This is not effort variance; it is technique variance. Top performers take optimal paths, batch tasks efficiently, and minimize wasted motion. Without visibility into what they do differently, these best practices cannot be replicated. Labor optimization makes the invisible visible by showing exactly what top performers do that others do not.
What Labor Optimization Reveals
- Travel efficiency: Top performers travel 25–35% less distance per task by taking optimal paths and batching nearby picks. The system recommends these paths to all operators.
- Task sequencing: Top performers complete tasks in optimal sequence to minimize backtracking. The system identifies these patterns and recommends them facility-wide.
- Idle time reduction: Top performers have 15–20% less idle time between tasks. The system identifies why and recommends process changes to reduce wait time.
- Equipment utilization: Top forklift operators achieve 78–85% utilization compared to 55–65% for bottom performers. The system identifies technique differences and recommends training.
- Zone productivity variance: Some zones consistently underperform. The system identifies whether it is due to slotting, layout, or operator technique.
Productivity Gain Outcomes
One e-commerce fulfillment center used labor optimization to analyze 85 pickers over 90 days. The system identified that top performers averaged 132 lines per hour compared to 88 lines per hour for bottom performers, a 50% variance. Analysis revealed top performers batched picks within three-aisle clusters while bottom performers picked randomly across the facility. Implementing cluster-based picking facility-wide increased average productivity from 98 to 118 lines per hour, a 20% gain equivalent to adding 17 FTEs without hiring. Another 3PL discovered their receiving productivity variance was caused by inconsistent putaway processes; standardizing based on top performer techniques increased receiving throughput by 28%.
Inventory Optimization
Inventory optimization uses AI to analyze pick density, SKU velocity, and order profiles to recommend dynamic reslotting as demand patterns shift. Most facilities slot inventory once using ABC velocity analysis and leave it unchanged for months, even though demand is never static. Seasonal products rise and fall, new SKUs gain traction, and promotions surge temporarily, making static slotting inefficient within weeks and increasing travel time while reducing throughput.
The Static Slotting Problem
Traditional ABC slotting categorizes SKUs as fast (A), medium (B), or slow (C) movers based on historical velocity, then places A items in golden zones near shipping. However, this approach has three main issues: it is backward-looking, as demand often changes before a reslot occurs; it ignores order profiles, since two A items with the same velocity but different order correlations should be placed differently; and it is static, because once slotted, inventory typically remains in the same location until someone manually updates it.
What AI Optimization Analyzes
- Pick density heatmaps: Identifies which locations are picked most frequently and recommends moving high-velocity SKUs to those golden zones.
- Order correlation analysis: Identifies SKUs frequently ordered together and recommends slotting them near each other to reduce travel.
- Velocity trend detection: Identifies SKUs with increasing velocity that should be moved to better locations before they become bottlenecks.
- Seasonal pattern recognition: Predicts seasonal velocity shifts and recommends proactive reslotting before demand materializes.
- Zone utilization balancing: Identifies underutilized zones and recommends redistributing inventory to balance pick density across the facility.
Efficiency Maintenance Outcomes
One retailer implemented AI-powered inventory optimization that continuously analyzed pick patterns and recommended reslotting weekly. Over 12 months, the system recommended 47 reslotting actions, each small and targeted. The cumulative impact was significant: average pick travel decreased from 185 feet to 118 feet (a 36% reduction), lines per hour increased from 92 to 128 (a 39% improvement), and efficiency remained stable through three major seasonal shifts. Another 3PL used inventory optimization to find that 12% of their A-velocity SKUs were stored in C-locations due to outdated velocity data. Correcting this reduced travel by 28% and increased throughput by 22%.
Regulatory Compliance
We make compliance effortless with automated tracking and
real-time audit readiness.
DOT Hours of Service
Automate driver and equipment tracking. Reduce compliance violations by 80%.
Deep DiveOSHA Safety Compliance
Forklift safety monitoring. Reduce workplace accidents by 60-75%.
Deep DiveFDA & Cold Chain Compliance
Continuous temperature monitoring. Prevent spoilage and regulatory violations.
Deep DiveDOT Hours of Service Compliance
The Department of Transportation requires strict tracking of driver hours and vehicle movements. RTLS automates compliance tracking for yard jockeys, hostlers, and on-site transportation without manual logbooks or ELD integration complexity.
Key Compliance Areas
- Automated tracking of yard jockey and hostler operating hours
- Trailer movement documentation for detention and demurrage disputes
- Dwell time tracking for compliance with free time agreements
- Automated audit trails for DOT inspections
- Integration with ELD systems for seamless compliance
Compliance Benefits
Automate compliance tracking to cut violations and remove manual documentation. Maintain full audit trails that meet DOT and industry standards.
OSHA Safety Compliance
OSHA requires comprehensive safety programs for material handling equipment and warehouse operations. RTLS enables automated safety monitoring, incident documentation, and proactive risk mitigation.
Safety Monitoring
- Forklift speed monitoring and geofencing for pedestrian zones
- Near-miss detection and automated incident reporting
- Operator certification tracking and access control
- Pre-shift inspection compliance verification
- Comprehensive audit trails for OSHA inspections
- Automated alerts for unsafe behaviors and conditions
Compliance Impact
Improve workplace safety and reduce incident risks through automated monitoring and real-time alerts. Strengthen safety culture with data-driven insights.
FDA & Cold Chain Compliance
The FDA Food Safety Modernization Act (FSMA) requires comprehensive tracking and temperature monitoring for food and pharmaceutical products. RTLS with integrated temperature sensors provides continuous compliance monitoring and automated documentation.
Compliance Capabilities
- Continuous temperature monitoring for cold chain products
- Automated alerts for temperature excursions and dwell time violations
- Complete chain of custody documentation from receiving to shipping
- Lot traceability for recalls and quality investigations
- Automated compliance reports for FDA audits
- Integration with quality management systems (QMS)
Risk Mitigation
Prevent product spoilage, reduce waste by 30–50%, and avoid costly recalls. FDA violations can result in fines, product seizures, and reputational damage.
Enterprise Integrations
We understand the tech ecosystem. Seamlessly connect with your existing
logistics IT infrastructure for unified operations and data flow across WMS, TMS,
ERP, and more.
WMS Integration
Manhattan, Blue Yonder, SAP EWM. Real-time inventory visibility and task automation.
Deep DiveTMS & Yard Management
Oracle TMS, MercuryGate, C3 Solutions. Automated check-in and dock scheduling.
Deep DiveERP Integration
SAP, Oracle, Microsoft Dynamics. Unified data flow across the enterprise.
Deep DiveCMMS & Fleet Management
Infor EAM, IBM Maximo. Automated maintenance scheduling and asset lifecycle management.
Deep DiveBI & Analytics Platforms
Tableau, Power BI, Qlik. Advanced analytics and custom reporting.
Deep DiveWMS Integration
RTLS integration with Warehouse Management Systems creates a unified view of inventory location, task execution, and labor productivity, eliminating data silos and enabling real-time decision-making.
The Static Slotting Problem
Key Integration Points
- Real-time inventory location updates (pallet, case, and item level)
- Automated task completion verification (putaway, picking, replenishment)
- Labor productivity tracking and performance analytics
- Cycle count automation and inventory accuracy improvement
- Exception handling and workflow optimization
- Integration via REST APIs, EDI, or direct database connections
Supported WMS Platforms
Manhattan SCALE, Blue Yonder (JDA), SAP EWM, Oracle WMS, Infor WMS, HighJump, Körber, and other major platforms.
TMS & Yard Management Integration
Integrating RTLS with Transportation Management Systems and Yard Management Systems creates end-to-end visibility from carrier arrival to departure, automating check-in, dock assignment, and detention management.
The Static Slotting Problem
Integration Benefits
- Automated trailer check-in when entering yard geofence
- Real-time yard visibility and trailer location tracking
- Intelligent dock door assignment based on load type and priority
- Automated detention tracking and carrier notifications
- Reduce detention fees by 50-70% through proactive management
- Improve dock door utilization by 20-30%
Supported Platforms
Oracle Transportation Management, MercuryGate, C3 Solutions, Yard Management Solutions (YMS), and other major platforms.
ERP Integration
Integrating RTLS with Enterprise Resource Planning systems provides real-time operational data to financial, procurement, and planning teams, enabling data-driven decision-making across the enterprise.
Integration Capabilities
- Real-time inventory valuation and location tracking
- Automated goods receipt and shipment confirmation
- Asset tracking and depreciation management
- Labor cost allocation by activity and location
- Integration with procurement for receiving automation
- Financial reporting and cost accounting integration
Supported ERP Platforms
SAP S/4HANA, Oracle ERP Cloud, Microsoft Dynamics 365, NetSuite, and other major platforms.
CMMS & Fleet Management Integration
Integrating RTLS with Computerized Maintenance Management Systems automates preventive maintenance scheduling, work order generation, and asset lifecycle management for material handling equipment.
Integration Benefits
- Automatic work order creation based on operating hours or cycles
- Real-time asset location for maintenance technicians
- Preventive maintenance compliance tracking and alerts
- Equipment lifecycle and depreciation management
- Reduce equipment downtime by 30-40%
- Extend asset life through proactive maintenance
Supported CMMS Platforms
Infor EAM, IBM Maximo, eMaint, Hippo CMMS, Fiix, and other major platforms.
BI & Analytics Platform Integration
Integrating RTLS with Business Intelligence platforms enables advanced analytics, custom reporting, and data visualization that combines location data with business metrics for comprehensive insights.
Analytics Capabilities
- Custom dashboards combining RTLS data with business KPIs
- Advanced analytics and predictive modeling
- Cross-functional reporting (operations, finance, HR)
- Data warehouse integration for historical analysis
- Self-service reporting for business users
- Mobile analytics and real-time alerts
Supported Platforms
Tableau, Microsoft Power BI, Qlik Sense, Looker, and other major platforms.
Ready to Transform Your
Logistics Operations?
Discover how our vendor-agnostic RTLS solutions can improve
operational efficiency, reduce costs,
and deliver measurable ROI
across your supply chain.
Frequently Asked Questions
Learn how Logistics RTLS Solutions improve visibility, efficiency, and ROI.
Tracking logistics is done using RTLS, which provides real-time visibility of assets, vehicles, and shipments across warehouses and yards. It helps locate items instantly, reduce search time, and streamline operations by integrating live tracking data into your logistics tracking system.
A digital twin in logistics is a virtual replica of your warehouse or supply chain environment. It mirrors real-time operations, allowing teams to simulate scenarios, predict bottlenecks, and optimize layouts before making physical changes using digital twin technology in logistics.
Tracking systems in logistics log all asset movements, operator activities, and environmental conditions automatically. This data helps maintain DOT and OSHA compliance, reduces paperwork, and improves safety through real-time alerts and analytics supported by logistics management systems.
RTLS systems in logistics improve asset visibility, reduce idle time, and enhance workflow efficiency. They help optimize equipment utilization, lower detention costs, and increase overall supply chain productivity within a digital twin supply chain environment.
Digital twins in logistics use real-time RTLS data to mirror warehouse and yard operations. They simulate process changes, predict capacity needs, and support better planning through insights gained from logistics and warehouse digital twins.