 Skip to content
A Comprehensive Guide to RTLS Digital Twins
What are RTLS Digital Twins?
RTLS digital twins are intelligent operational systems that merge real-time location tracking (indoor positioning systems) with dynamic 3D simulation models, by combining live spatial intelligence with digital twin modeling, they deliver centimeter-level accuracy and sub-second latency for reality-based simulation and actionable insights.
Stage 1
Real-Time Location Intelligence Collection
LocaXion RTLS captures precise spatial data and movement patterns across your entire operation.
Stage 2
Digital Twin Dynamic Optimization
Location data feeds Digital Twin models for real-time simulation and predictive optimization.
Stage 3
Autonomous Operational Enhancement
Optimized insights automatically improve operations, generating new data for continuous improvement.
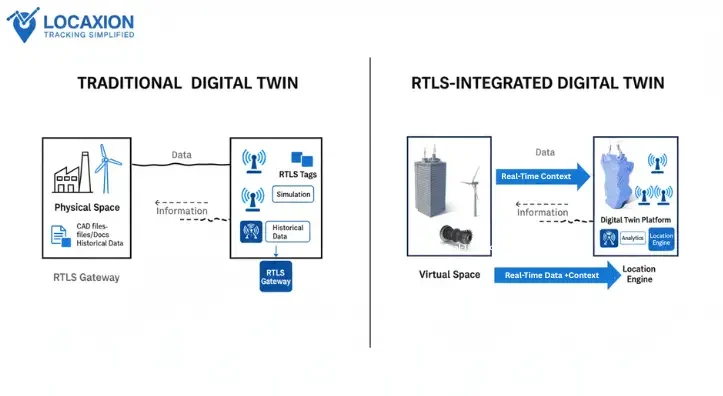
Why Traditional Digital Twins Fail Without RTLS Integration?
Traditional Digital Twins operate on static assumptions and outdated data, while RTLS + Digital Twin integrated platformsion delivers real-time spatial intelligence that transforms reactive reporting into proactive operational control.
Traditional Digital Twins
The Location Intelligence Gap
- Static Spatial Assumptions
Models assume assets stay where they're supposed to be - Yesterday's Reality
Decisions based on hours-old or manually updated data - Reactive Reporting
Tells you what went wrong after productivity was already lost - Simulation Guesswork
What-if scenarios based on theoretical data, not operational reality
RTLS + Digital Twin
Real-Time Location Intelligence
- Dynamic Spatial Reality
Models reflect actual asset locations and movements in real-time - Live Operational Data
Decisions based on current reality, updated every second - Proactive Control
Prevents problems before they impact productivity - Reality-Based Simulation
What-if scenarios using your actual operational patterns and data
Levels of RTLS Digital Twin Maturity
Understanding RTLS Digital Twin implementation requires recognizing it as an evolving process, not a one-time deployment. Each stage delivers immediate value while building the foundation for data-driven insights, predictive optimization, and smarter operational control.
Real-Time Visibility
Foundation of Spatial Intelligence
Complete spatial awareness of every asset, person, and process
- Find any asset in seconds
- Live facility-wide overview
- Historical pattern analysis
Measure & Control
Operational Intelligence
Transform location data into actionable insights and predictions
- Spatial process analytics
- Predictive intelligence
- Automated control systems
Planning & Simulation
Autonomous Enhancement
Test changes digitally and enable self-improving operations
- Reality-based modeling
- What-if scenario testing
- Autonomous optimization
Why Traditional Digital Twins Fail?
Traditional Digital Twins operate on static assumptions and outdated data, while RTLS + Digital Twin integration delivers real-time spatial intelligence that transforms reactive reporting into proactive operational control.
Traditional Digital Twins
The Location Intelligence Gap
- Static Spatial Assumptions
Models assume assets stay where they're supposed to be - Yesterday's Reality
Decisions based on hours-old or manually updated data - Reactive Reporting
Tells you what went wrong after productivity was already lost - Simulation Guesswork
What-if scenarios based on theoretical data, not operational reality
RTLS + Digital Twin
Real-Time Location Intelligence
- Dynamic Spatial Reality
Models reflect actual asset locations and movements in real-time - Live Operational Data
Decisions based on current reality, updated every second - Proactive Control
Prevents problems before they impact productivity - Reality-Based Simulation
What-if scenarios using your actual operational patterns and data
Core Components of RTLS-powered Digital Twin
Discover the five-layer architecture of an enterprise digital twin platform that transforms raw location data into autonomous operational intelligence through real-time spatial processing and AI-powered optimization.
Physical Reality Layer
Spatially Enhanced
- RTLS Infrastructure (UWB, BLE, RFID)
- Environmental Sensors with Spatial Correlation
- Industrial-Grade Asset Tags & Wearables
Real-Time Data Fusion Layer
- Spatial-Temporal Processing (<1s updates)
- Multi-Sensor Integration & Correlation
- AI-Powered Movement Intelligence
Digital Twin Modeling Layer
Spatially Enhanced
- 4D Spatial Models (3D + Time)
- Physics-Based Real-Time Simulation
- Dynamic Process Optimization Models
Location Intelligence Analytics Layer
- Spatial Analytics Engine
- Predictive Location Modeling
- Autonomous Anomaly Detection
Autonomous Control & Interface Layer
- Real-Time Control Systems
- Predictive Dashboards
- Automated Response Systems
The Power of Integrated Architecture
Real-Time Intelligence
Sub-second data processing enables immediate response to operational changes and anomalies
Predictive Optimization
AI-powered analytics predict and prevent issues before they impact operations
Autonomous Control
Self-optimizing systems continuously improve operations without manual intervention
An In-Depth Analysis of RTLS Technologies
For comprehensive RTLS technology comparison and selection guidance, explore our complete
RTLS Technology GuideReal-World Use Cases of RTLS Digital Twin Platforms
Learn how embedding real-time location intelligence into digital twin platforms revolutionizes operations in manufacturing, healthcare, and logistics across three progressive stages: Level 1 – Visibility, Level 2 – Measure & Control, and Level 3 – Planning & Simulation.
Manufacturing
From Manual Oversight to Autonomous Production Intelligence Watch how a traditional production line evolves into a self-optimizing intelligent system through progressive RTLS Digital Twin implementation
Live Production View
"Production line goes down. Is it a missing test jig for quality checks? Is the required sub-assembly still in the paint shop? Is the certified operator on break or temporarily reassigned?"
Hidden Process Insights
"Your Digital Twin visualizes the 'spaghetti diagram' of your material handlers, but goes deeper. It reveals that 40% of all forklift and AGV travel is 'empty runs.'"
What If Scenarios
"Management wants to introduce a new product line into your existing facility. Where does the new cell go? How will it impact the flow of existing materials and the demand on shared resources?"
Healthcare: From Equipment Searches to Predictive Patient Care
Transform healthcare operations from reactive equipment management to proactive patient flow optimization
Instant Equipment Location
"Nurses were spending 30% of their shift looking for equipment. Now they find what they need in seconds, giving them more time for patient care."
Predictive Patient Flow
"We can now predict ED bottlenecks 2 hours before they happen and automatically adjust staffing and bed assignments to prevent overcrowding."
Autonomous Care Coordination
"The system now automatically coordinates room cleaning, equipment delivery, and staff assignments based on real-time patient needs and flow patterns."
Logistics: From Manual Tracking to Autonomous Fulfillment
Evolution from basic inventory tracking to fully autonomous warehouse operations with predictive optimization
Complete Warehouse Visibility
"We eliminated the 'lost inventory' problem completely. Every pallet, every piece of equipment, every worker is tracked in real-time across our 500,000 sq ft facility."
Intelligent Flow Optimization
"The system identified that 40% of our forklift movements were empty runs. We redesigned our workflows and improved efficiency by 35% without adding equipment."
Autonomous Fulfillment
"Our warehouse now operates like a self-organizing organism. The system automatically optimizes picking routes, manages AGV traffic, and predicts maintenance needs."
RTLS Digital Twin Implementation Guide
The six-phase RTLS digital twin implementation framework provides a structured path for successful deployment, seamless user adoption, and measurable long-term value. By aligning technology, processes, and people, it enables organizations to scale digital twin platforms across complex enterprise environments with confidence.
Strategic Assessment & Use Case Definition
Current state analysis and location intelligence audit with use case prioritization and ROI projections
Key Deliverables:- Current state analysis
- Use case prioritization
- Success metrics definition
Architecture Design & Technology Selection
Environmental site survey and RF propagation analysis with integration architecture design
Key Deliverables:- Site survey
- Architecture design
- Technology selection
Pilot Implementation & Validation
Infrastructure deployment and Digital Twin integration with performance testing
Key Deliverables:- Pilot deployment
- Performance testing
- Validation results
Scale-Up Planning & Preparation
Enterprise scaling strategy and resource planning with change management preparation
Key Deliverables:- Scaling strategy
- Resource planning
- Change management
Enterprise Deployment & Integration
Phased infrastructure rollout with business process integration and workflow automation
Key Deliverables:- Infrastructure rollout
- Process integration
- ROI measurement
ROI Framework for RTLS Digital Twin Platform Solutions
Understand the progressive value creation model that delivers exponential returns through three levels of RTLS Digital Twin implementation, each building upon the last to create compounding business value.
Level 1: Visibility
Transform blind operations into complete spatial awareness with real-time asset and personnel tracking
Key Capabilities:- Real-time location tracking with sub-meter accuracy
- Historical movement analytics and pattern recognition
- Eliminate 80-95% of search time across operations
- Increase asset utilization rates by 25-40%
Level 2: Measure & Control
Leverage predictive analytics and process optimization to prevent issues before they occur
Key Capabilities:- Predictive analytics for bottleneck identification
- Dynamic workflow optimization algorithms
- Predict and prevent 70-90% of operational disruptions
- Optimize resource allocation reducing cycle times 25-35%
Level 3: Planning & Simulation
Achieve autonomous operational optimization through self-learning systems and continuous improvement
Key Capabilities:- AI-powered autonomous optimization engines
- Self-adapting algorithms for changing conditions
- Autonomous operational optimization without human intervention
- Self-adapting systems that improve performance over time
Overcoming RTLS Digital Twin Integration Challenges
Navigate common integration challenges with proven solutions and expert guidance that ensures successful real time digital twin deployment with accurate data and sustained operational value.
Data Synchronization & Latency
Real-time data processing challenges with enterprise systems integration and edge computing solutions for sub-50ms latency.
Accuracy & Environmental Interference
Multi-sensor fusion algorithms combining UWB, BLE, and WiFi technologies to maintain precision in challenging RF environments.
Scalability & Performance
Cloud-native microservices architecture with auto-scaling capabilities to handle 10,000+ tracked assets efficiently.
Enterprise System Integration
Standardized API gateway and integration platform for seamless connectivity with ERP, MES, and WMS systems.
Change Management & Adoption
Comprehensive stakeholder engagement and role-based training programs to ensure high user adoption rates.
Data Privacy & Security
Zero-trust security architecture with end-to-end encryption and compliance monitoring for regulatory adherence.
Asset Tag Lifecycle Management
Automated provisioning, health monitoring, and predictive maintenance systems for optimal tag performance.
ROI Measurement & Justification
Comprehensive KPI frameworks and real-time value tracking systems to demonstrate continuous business impact.
RTLS Digital Twin Success Stories: Real-World Implementations and Results
Explore proven real time digital twin implementations across industries with quantified results and validated ROI through comprehensive case studies and verified industry benchmarks.
German Automotive OEM - Tool Management Excellence
Challenge: 15,000+ specialized tools across 2M sq ft facility with critical tool loss and quality...
Solution: Ultra-Wideband (UWB) infrastructure with 10–30cm...
Key Results:
Top-5 US Health System - Equipment & Patient Flow
Challenge: 800-bed facility with nurses spending 21% of shift time searching for equipment...
Solution: BLE beacons and Wi-Fi based RTLS leveraging...
Key Results:
Global 3PL Provider - Distribution Center Transformation
Challenge: 500,000 sq ft distribution center with 98.5% picking accuracy...
Solution: UWB-based positioning for forklifts and AGVs...
Key Results:
European Steel Manufacturer - Safety in Harsh Environments
Challenge: Extreme industrial environment with temperatures from -20°C to +1200°C, high
Solution: Industrial-grade UWB with mesh networking, intrinsically
Key Results:
Major Aerospace Manufacturer - FOD Prevention & Tool Control
Challenge: Regulatory requirement for 100% tool accountability...
Solution: Ultra-high precision UWB with 10cm accuracy, blockchain...
Key Results:
Industry-Verified Benchmarks
150–250%
Typical 3-Year ROI
Gartner Research 202314–24
Months Payback
ARC Advisory Group20–35%
Asset Utilization Gain
IDC Manufacturing70–90%
Search Time Reduction
McKinsey InstituteFrequently Asked Questions: RTLS Digital Twin Implementation
Get answers to common questions about Digital Twin implementation, benefits, and best practices from our experts who have successfully deployed Digital Twin solutions across various industries.
What's the difference between RTLS Digital Twin and traditional Digital Twin solutions?
Traditional Digital Twins rely on static data and manual updates, creating a delayed representation of reality. RTLS Digital Twins use real-time location data to create living, breathing models that reflect actual operational conditions as they happen. This enables proactive decision-making instead of reactive reporting.
How accurate is RTLS technology, and what factors affect accuracy?
Modern RTLS technologies achieve sub-meter accuracy, with UWB systems reaching 10-30cm precision. Accuracy depends on technology choice, environmental factors, infrastructure design, and calibration. Our site surveys identify potential interference sources and optimize placement for maximum accuracy.
What's the expected ROI and how quickly can we see results?
Enterprise implementations typically take 3-6 months from planning to full deployment. This includes 2-4 weeks for assessment, 4-8 weeks for pilot implementation, and 8-16 weeks for enterprise rollout. Timeline varies based on facility size, complexity, and integration requirements.
How do you ensure data security and privacy in RTLS Digital Twin systems?
We implement comprehensive security frameworks including end-to-end encryption, role-based access controls, secure API gateways, and compliance monitoring. All data transmission and storage follows industry standards like ISO 27001, and we support air-gapped deployments for sensitive environments.
What's the expected ROI and how quickly can we see results?
Typical ROI ranges from 300-600% within 18 months, with initial benefits visible within 30 days. Quick wins include reduced search times and improved asset utilization. Longer-term benefits include process optimization, predictive maintenance, and strategic decision support capabilities.
How does RTLS Digital Twin integrate with existing enterprise systems?
Integration uses standardized APIs and middleware to connect with ERP, MES, WMS, and other enterprise systems. We support both real-time data streaming and batch processing, with pre-built connectors for major platforms like SAP, Oracle, Microsoft, and others.
What happens if the RTLS infrastructure fails or needs maintenance?
Systems include redundancy planning, backup procedures, and graceful degradation modes. Critical operations can continue with reduced functionality while infrastructure is restored. Maintenance windows are planned during low-activity periods.
How do you measure ROI from Digital Twin investments?
ROI is measured through cost savings (reduced maintenance, downtime, energy consumption), revenue enhancement (faster development, new services, improved quality), and risk mitigation (prevented failures, compliance automation). Most organizations see positive ROI within 18-24 months with proper implementation.
How do you validate business value and track ongoing performance?
Validation includes baseline measurement, KPI tracking, and continuous monitoring dashboards. Performance metrics cover operational efficiency, safety compliance, and financial impact with regular reporting and optimization recommendations.
What factors should be considered when scaling from pilot to enterprise deployment?
Scaling considerations include infrastructure capacity, user training programs, change management processes, system performance optimization, and phased rollout planning. Success depends on proven pilot results and stakeholder buy-in.
How do you future-proof RTLS + Digital Twin investments against technology evolution?
Future-proofing strategies include open architecture design, vendor-agnostic platforms, modular system components, and technology roadmap alignment. Regular assessment ensures compatibility with emerging technologies like 5G, AI/ML, and edge computing.
Still have questions?
Schedule a ConsultationThe Continuous Improvement Engine
How RTLS Digital Twins Create Self-Optimizing Operations
Traditional improvement methodologies rely on periodic assessments and manual interventions. RTLS Digital Twins reimagine continuous improvement as an automated, perpetual process operating at the speed of data, not quarterly reviews.
The Four-Stage Perpetual Optimization Cycle
1. Visualize
Real-time visualization creates intuitive understanding of complex operational dynamics impossible to grasp through numbers alone.
2. Measure
Revolutionary measurement captures previously invisible operational dimensions with automated KPI calculation.
3. Simulate
Transform decision-making from educated guessing to scientific prediction. Every operational change tested digitally first.
4. Optimize
Insights transform into actions, generating new data for the next cycle through three levels of optimization hierarchy.
Deep Dive: How Each Stage Works
Key Insights
- Visual info processed 60,000x faster than text
- KPIs generated without manual data entry
- Simulation prevents costly mistakes before deployment
- Human role shifts from manual optimization to strategy
Deep Dive: How Each Stage Works
Visualize
Real-time visualization creates intuitive understanding of complex operational dynamics impossible to grasp through numbers alone.
Key Capabilities:
- 2D/3D facility maps with real-time positions
- Time-series analysis revealing patterns
- Actual vs. designed workflow diagrams
- Asset, people, and process relationships
- Future state projections
Key Insight:
The human brain processes visual information 60,000× faster than text. Operators respond intuitively and immediately to visual bottlenecks.
Measure
Revolutionary measurement captures previously invisible operational dimensions with automated KPI calculation.
Key Capabilities:
- Interaction Analytics: proximity time between assets/operators
- Path Efficiency: actual vs. theoretical minimum distance
- Dwell Time Distribution: statistical wait analysis
- Flow Velocity: movement speed through stages
- Congestion Costs: quantified bottleneck impact
Key Insight:
Hundreds of KPIs calculated automatically without manual entry, including OEE, FTR rates, and resource utilization based on actual presence.
Simulate
Transform decision-making from educated guessing to scientific prediction. Every operational change tested digitally first.
Key Capabilities:
- Flow modeling with current throughput
- Agent-based simulation of individual behavior
- Physics-based digital twin simulation
- Monte Carlo analysis for risk/variability
- Automated continuous scenario testing
Key Insight:
Simulation revealed adding a new product line would reduce throughput by 23% due to shared inspection station — saving $2M in losses.
Optimize
Insights transform into actions, generating new data for the next cycle through three levels of optimization hierarchy.
Key Capabilities:
- Assisted: system recommends, human approves
- Semi-Autonomous: auto-implements approved tasks
- Fully Autonomous: continuous micro-adjustments
- Self-Learning: algorithms improve over time
- Predictive: prevents issues before they occur
Key Insight:
Human role shifts from manual optimization to strategy and constraint setting as the system achieves autonomous operation.
The Compounding Effect: Why Continuous Beats Periodic
Daily Micro-Improvements
0.1% daily efficiency gain compounds to 44% annually
Instant Problem Resolution
Problems identified and resolved in minutes, not months
Organizational Learning
Best practices automatically identified and propagated
Accelerated Onboarding
New employees learn through simulation and codified knowledge
Ready to Build Your Continuous Improvement Engine?
Transform your operations with RTLS Digital Twins that learn, adapt, and optimize automatically — creating compound improvements that accelerate over time.
Discover More About RTLSTraditional Digital Twin vs RTLS Digital Twin
The Fatal Flaws of Traditional Digital Twins
Understanding the fundamental differences and why location intelligence changes everything
The Dangerous Assumption
Traditional digital twins assume the physical world matches the model. In real operations, this breaks down catastrophically, creating digital theater instead of operational intelligence.
Planned vs. Actual Positioning
Traditional: Assets are where WMS says
Reality: 15–30% mislocated
Static vs. Dynamic Behavior
Traditional: Prescribed workflows
Reality: Operators create shortcuts
Theoretical vs. Actual Timing
Traditional: Engineered standards
Reality: ±40% variability
The Five Critical Gaps in Traditional Digital Twins
Gap 1: Temporal Disconnect
Traditional Data Delays:
- Manual entry: 4–24 hrs
- Batch processing: 1–8 hrs
- System sync: 15–60 mins
RTLS Solution:
Gap 2: Spatial Blindness
Case Study – Distribution Center
A traditional twin showed optimal pick paths. The RTLS Digital Twin revealed 40% deviations due to congestion zones.
Result: 25% productivity improvement
Gap 3: Granularity Gulf
Traditional Granularity
- Hourly counts
- Daily utilization
- Weekly quality metrics
- Monthly reports
RTLS Granularity
- Second-by-second updates
- Minute flow analysis
- Real-time interactions
- Instant anomaly detection
Gap 4: Integration Impediment
Traditional Challenges
- Incompatible formats
- Conflicting cycles
- Limited APIs
- Poor data quality
RTLS Advantage
- Single source of truth
- Position-based correlation
- Event-driven architecture
- Self-validating data
Gap 5: Simulation-Reality Chasm
Why Traditional Fails
- Theoretical models only
- No human factors
- No environment data
- No outcome validation
RTLS Simulation Accuracy
- Millions of datapoints
- Human patterns included
- Environment monitored
- Auto-calibrated from outcomes
The Hidden Costs of Inadequate Digital Twins
Direct Costs
- Manual data collection
- Simulation re-validation
- Frequent recalibration
- Limited ROI
Opportunity Costs
- Delayed issue detection
- Missed optimizations
- Slow innovation
- Competitive disadvantage
Risk Costs
- Inaccurate decisions
- Compliance issues
- Safety incidents
- Customer impacts
The Transformation: From Digital Theater to Operational Intelligence
Traditional Twin
- ❌ Wrong visualizations
- ❌ Historical, not real-time
- ❌ Unvalidated simulations
- ❌ Quarterly improvements
RTLS Digital Twin
- ✅ Mirrors reality in cm accuracy
- ✅ Predictive, prevents issues
- ✅ Validated by millions of data points
- ✅ Continuous optimization
Ready to Experience the RTLS Advantage?
Transform your digital twin from passive reporting into an intelligent, predictive, self-optimizing system.
Learn More About Digital TwinsRTLS Digital Twin Maturity Journey
A comprehensive guide to the three levels of RTLS Digital Twin implementation, from foundational visibility to autonomous operational intelligence.
Level 1
Real-Time Visibility
Level 2
Measure & Control
Level 3
Planning & Simulation
Level 1 – Real-Time Visibility 4–8 weeks pilot, 3–4 months rollout
The Foundation of Spatial Intelligence
Transform operations from assumption-based to evidence-based decision making with complete spatial awareness.
Core Capabilities
Instant Location Intelligence
- Locate any tagged asset within seconds
- Real-time position updates every 1–10 seconds
- Historical location playback
- Geofence alerts for violations
Live Operational Overview
- Unified facility-wide dashboard
- Heat maps showing traffic patterns
- Real-time occupancy metrics
- Mobile applications for staff
Industry Applications
Manufacturing
- Tool tracking across production floors
- WIP visibility through stages
- Mobile asset utilization
- Critical component location
Healthcare
- Medical equipment tracking
- Staff duress monitoring
- Patient flow visualization
- Asset PAR level management
Logistics
- Yard management & trailer tracking
- Cross-dock operations visibility
- Material handling equipment
- Inventory zone management
Expected Outcomes
- Search time: 30+ minutes → under 30 seconds
- Asset utilization improvement: 15–25%
- Inventory accuracy: 99%+
- Immediate ROI through found assets
Level 2 – Measure & Control 2–4 months implementation
Transforming Data into Operational Intelligence
Transcend simple tracking to deliver deep operational insights through spatial analytics and predictive intelligence.
Core Capabilities
Spatial Process Mining
- Spaghetti diagrams actual vs planned
- Bottleneck identification
- Distance optimization
- Process deviation detection
Predictive Intelligence
- Queue time predictions
- Usage-based maintenance
- Demand forecasting
- Anomaly detection
Automated Control Systems
- Dynamic work assignment
- Automatic SLA escalation
- Occupancy-based control
- AGV collision avoidance
Key Insights Revealed
Movement analytics consistently reveal:
- 30–40% of handler movement = empty travel
- 15–20% of nursing shifts lost to equipment search
- Cross-contamination risks from paths
- Overtime correlates with bottlenecks
Expected Outcomes
- Process efficiency +25–35%
- Labor productivity +20–30%
- Compliance-driven quality improvements
- Predictive downtime reduction 15–20%
Level 3 – Planning & Simulation 6–12 months full implementation
Autonomous Operational Intelligence
Enable organizations to simulate changes before implementation and create self-improving systems that adapt autonomously.
Core Capabilities
Digital Experimentation
- Test layout changes
- Simulate product impact
- Model staffing scenarios
- Validate process changes
What-If Analysis
- Production line impact
- Relocation simulations
- Equipment optimization
- Multi-variable testing
Autonomous Optimization
- Dynamic slotting
- Automatic work queue rebalancing
- Self-adjusting safety zones
- Predictive dispatching
Continuous Learning
- Optimal path learning
- Failure mode prediction
- Pattern-based process improvements
- Seasonal variation adaptation
Expected Outcomes
- Autonomous operations
- Risk-quantified decision support
- Innovation via prototyping
- Competitive advantage through agility
- New business models
Ready to Begin Your RTLS Digital Twin Journey?
Each maturity level builds upon the previous, creating exponential value. Start with Level 1 and evolve toward autonomy.
Get Expert Real-Time Digital Twin ConsultationBuilding Blocks of RTLS Digital Twins
The Five-Layer Architecture That Powers Autonomous Operations
Integrated Architecture Advantage
Creating an RTLS Digital Twin requires more than just combining location tracking with simulation software. It demands a carefully orchestrated architecture where each layer serves a specific purpose while seamlessly integrating with others to create operational intelligence that’s greater than the sum of its parts.
Layer 1 Physical Reality Layer
The Spatial Foundation
Forms the sensory nervous system of your digital twin, capturing every movement, interaction, and environmental condition across operations.
Key Capabilities
- Ultra-Wideband (UWB): 10–30cm accuracy, 100Hz updates
- Bluetooth Low Energy (BLE): 1–5cm accuracy, improving with AoA/AoD
- Active RFID Systems: Zone-based tracking up to 100m
- Environmental sensors with spatial correlation
- Industrial-grade multi-tech asset tags
Technical Specifications
- Infrastructure Density: 1 anchor per 400–1000 sq m
- Battery Life: 1–7 years (depending on tech)
- Update Rates: Up to 100Hz for critical apps
- Environmental Monitoring: Temp, humidity, vibration, air quality
Layer 2 Real-Time Data Fusion Layer
The Intelligence Pipeline
Transforms millions of position updates into actionable intelligence through advanced processing and AI-powered analytics.
Key Capabilities
- Sub-100ms latency for critical decisions
- 90% bandwidth reduction via filtering
- Kalman filtering for precision enhancement
- Multi-sensor fusion algorithms
- Context-aware validation
Technical Specifications
- Processing Volume: 80M+ position records daily (1000 assets)
- Edge Processing: Real-time detection & response
- Cloud Processing: ML model training
- Hybrid Architecture: Edge + cloud blend
Layer 3 Digital Twin Modeling Layer
The Virtual Operations Center
Creates living, breathing digital representations that mirror and predict physical reality through 4D spatial models.
Key Capabilities
- 4D Spatial Models (3D + Time) with replay
- Physics-based simulation engines
- Discrete Event Simulation (DES)
- Agent-Based Modeling (ABM)
- Multi-objective optimization algorithms
Technical Specifications
- Model Fidelity: From geometric to physics-enabled
- Simulation Types: DES, ABM, continuous
- Optimization: Real-time constraint programming
- Temporal Analysis: Replay at any speed
Layer 4 Location Intelligence Analytics Layer
The Insight Engine
Transforms data into decisions through advanced analytics powered by spatial context and predictive modeling.
Key Capabilities
- Spatial metrics: Distance, proximity, zone analytics
- Predictive modeling from seconds to months ahead
- Autonomous anomaly detection
- Multi-dimensional pattern recognition
- Behavioral optimization recommendations
Technical Specifications
- Short-term Predictions: Collisions, queues
- Medium-term Predictions: Demand, scheduling
- Long-term Predictions: Capacity, layouts
- Anomaly Types: Spatial, temporal, behavioral, contextual
Layer 5 Autonomous Control & Interface Layer
The Action Layer
Where insights become actions through real-time control systems and human-machine collaboration.
Key Capabilities
- Closed-loop control with fail-safe
- AGV/AMR fleet dynamic path planning
- Environmental controls from occupancy
- Production optimization control
- Role-based dashboards
Technical Specifications
- Automation Levels: Manual → full autonomous
- Integration: AGV, HVAC, lighting, production
- Interface: Operator, supervisor, executive
- Response: Automated optimization & self-healing
Emergent Capabilities When Layers Work Together
System detects and corrects issues automatically before they impact operations
Changes made before problems occur through advanced forecasting
Continuous improvement without programming through AI-powered insights
Automation Maturity Journey
- 0 Level 0: Manual Control – Humans decide, system provides info only
- 1 Level 1: Decision Support – System recommends, humans approve
- 2 Level 2: Supervised Automation – System executes, humans handle exceptions
- 3 Level 3: Conditional Automation – Complex cases handled, humans set policies
- 4 Level 4: High Automation – System operates independently, humans monitor
- 5 Level 5: Full Automation – Self-optimizing, humans focus on innovation
Ready to Build Your RTLS Digital Twin?
Unlock operational intelligence with a layered architecture that evolves from tracking to autonomous optimization.
Avail RTLS + Digital Twin Integration ServicesManufacturing RTLS Digital Twin Implementation
Transform your production floor through three progressive stages: from reactive visibility to predictive intelligence to autonomous optimization.
Stage 1: The Visibility Twin
Your Live Factory Floor
Core Concept
Illuminate your entire production environment with real-time visibility. Every critical mobile equipment, high-value tool, WIP pallet, and AGV appear on a single dynamic map—eliminating manual scans, paper trails, and wasted searches.
Real Manufacturing Scenario
The Problem: Production line goes down. Missing test jig? Sub-assembly stuck? Operator unavailable?
The Solution: Instead of frantic investigation, you see it all instantly: jig in calibration lab, sub-assembly two minutes away, operator assisting nearby. A 30-minute crisis solved in seconds.
Instantly locate any critical asset—from tools and test equipment to MHE and WIP
Find the root cause of stoppages instantly, eliminating costly production delays
Reduce wasted motion for operators and supervisors with a single source of truth
Gain complete situational awareness of your entire shop floor, all the time
Stage 2: The Measure & Control Twin
From Data to Production Intelligence
Core Concept
With a foundation of live visibility, your Digital Twin now becomes an analytical powerhouse. It doesn't just show you where things are; it shows you how they interact and perform over time. It contextualizes location data, revealing the hidden inefficiencies in your workflows, material flow, and resource utilization.
Real Manufacturing Scenario
The Problem: Your Digital Twin visualizes the "spaghetti diagram" of your material handlers, but goes deeper. It reveals that 40% of all forklift and AGV travel is "empty runs."
The Solution: By correlating the dwell time of WIP pallets at specific work cells with the OEE of those machines, it proves that Cell 5 is consistently starved for components between 2-4 PM, causing hidden micro-stoppages that kill your efficiency. This isn't just a map; it's a deep diagnostic of your entire value stream.
Optimize material flow by identifying and eliminating inefficient routes and empty runs.
Uncover the root causes of production bottlenecks by correlating asset movement with performance data.
Validate and supercharge your lean initiatives with objective, undeniable data.
Improve Overall Equipment Effectiveness (OEE) by ensuring assets, tools, and materials are always where they need to be.
Stage 3: The Planning & Simulation Twin
Engineer Your Future Production, Virtually
Core Concept
This is where your smart factory becomes a strategic weapon. Your Digital Twin evolves into a perfect virtual replica of your production environment, fed by your actual, real-world operational data. It becomes a risk-free sandbox to test, validate, and optimize any change before investing a single dollar or disrupting the floor.
Real Manufacturing Scenario
The Problem: Management wants to introduce a new product line into your existing facility. Where does the new cell go? How will it impact the flow of existing materials and the demand on shared resources?
The Solution: Using the Simulation Twin, you model three potential layouts. You simulate the new MHE routes, the strain on shared forklifts, and the required buffer sizes for both new and existing lines. The simulation proves that the most "obvious" location would create a massive bottleneck, while a less intuitive spot, combined with a small change in AGV logic, allows for seamless integration and even improves the efficiency of an existing line by 10%.
Test new line layouts and process flows without stopping production for a single minute.
Accurately predict the impact of any change on throughput, cycle time, and resource utilization.
Optimize resource allocation—from machinery to staff—for complex production mixes.
De-risk multi-million dollar capital investments by proving their ROI in a virtual environment first.
Ready to Transform Your Manufacturing?
From real-time visibility to predictive intelligence, accelerate production efficiency with RTLS Digital Twins.
Explore Real-Time Digital Twin in ManufacturingHealthcare RTLS Digital Twin Implementation
Transform your hospital through three progressive stages: from reactive visibility to predictive intelligence to autonomous optimization.
Stage 1: The Visibility Twin
Your Live Hospital Environment
Core Concept
Create a single source of truth for your entire facility. Move beyond systems and whiteboards to a live, dynamic hospital map where every critical asset, staff, and patient location is visible in real-time.
Healthcare Scenario
The Problem: A “code blue” is called on the cardiac floor. The charge nurse needs the nearest crash cart, the cardiologist, and an ICU bed—immediately.
The Solution: Instead of frantic phone calls, a glance at the Visibility Twin shows the nearest cart is one room over, locates the cardiologist in the adjacent wing, and confirms ICU Bed 4 is prepped and ready. A life-threatening delay becomes a coordinated, instantaneous response.
Locate critical medical equipment, reducing search times from minutes to seconds
Real-time visibility into bed status and patient location
Understanding where clinicians are and deploying them effectively
Improve patient safety and satisfaction through faster response times
Stage 2: The Measure & Control Twin
From Data to Clinical Intelligence
Core Concept
The Digital Twin becomes a process improvement engine. It tracks patient, staff, and equipment interactions over time, uncovering bottlenecks and inefficiencies in workflows.
Healthcare Scenario
The Problem: Hospital administrators are tackling long Emergency Department wait times.
The Solution: The Digital Twin analyzes the entire patient journey and reveals that the primary bottleneck isn't bed availability, but a consistent 90-minute delay in patient transport to radiology. It also shows 30% of the wheelchair fleet is clustered, unused, on one floor. This intelligence enables targeted fixes—revising transport workflows and rebalancing mobile assets—slashing ED wait times.
Drastically reduce patient wait times by identifying and resolving workflow bottlenecks
Maximize utilization of high-value equipment like IV pumps and telemetry monitors
Streamline patient discharge and room cleaning processes
Analyze movement patterns and eliminate wasted steps
Stage 3: The Planning & Simulation Twin
Design the Future of Care, Virtually
Core Concept
Your Digital Twin evolves into a perfect virtual replica of your facility, powered by your own real-world data. It becomes a risk-free environment to model, test, and validate any operational or physical change before committing resources.
Healthcare Scenario
The Problem: The hospital is planning a new infectious disease wing. How will the layout impact staff exposure risk? What's the most efficient layout for nurse travel paths and supply delivery?
The Solution: Using the Simulation Twin, planners model different room configurations and workflows. They simulate patient surge scenarios to test staffing models and resource needs, ensuring the new wing is both safe and hyper-efficient from day one, all before the first wall is built.
Optimize new construction or departmental renovations before breaking ground
Refine clinical protocols and patient flow strategies in a virtual environment
Develop robust emergency plans by simulating patient surge events
Match predicted patient demand with data-driven confidence
Ready to Transform Your Healthcare Facility?
From visibility to predictive intelligence, accelerate care delivery with RTLS Digital Twins.
Explore Real-Time Digital Twin in HealthcareLogistics RTLS Digital Twin Implementation
Transform your warehouse and distribution operations through three progressive stages: from reactive visibility to predictive intelligence to autonomous optimization.
Stage 1: The Visibility Twin
Your Live Warehouse & Yard
Core Concept
The journey starts by eliminating the black holes in your operation. Forget manual check-ins and system-only inventory locations. This is your entire facility—every forklift, every pallet jack, every high-value shipment, and every worker—visualized on a single, dynamic map that covers the yard, the dock doors, and the warehouse floor in real-time.
Real-World Scenario
The Problem: A truck carrying a high-priority inbound shipment arrives an hour early. Meanwhile, a picker on the floor cannot find a specific pallet for a critical outbound order, threatening to miss a delivery SLA.
The Solution: A glance at the Visibility Twin shows the early truck in the yard and an open dock door it can be assigned to. It also pinpoints the “missing” pallet, mistakenly placed in a bulk storage aisle. A potential domino effect of delays is resolved in seconds.
All assets, from trucks in the yard to pallets on the floor
For inventory, MHE, and personnel
Reduce driver detention fees
Prevent costly shipping errors
Stage 2: The Measure & Control Twin
From Data to Fulfillment Intelligence
Core Concept
With total visibility established, your Digital Twin becomes your operational analyst. It contextualizes location data to uncover bottlenecks in receiving, putaway, picking, and shipping processes.
Real-World Scenario
The Problem: Your WMS reports good overall performance, but you’re still missing SLAs.
The Solution: Your Digital Twin visualizes the "spaghetti diagram" of your forklift fleet, revealing chaotic, overlapping routes and that 30% of all travel is "empty forks." By analyzing the dwell time of pallets from dock-to-stock, it proves your receiving process is creating downstream inventory shortages for your pickers, forcing them to wait. This is the root cause of your missed SLAs.
Increase lines picked per hour
Dock-to-stock and stock-to-dock
In aisles and staging areas
MHE movement analysis and compliance
Stage 3: The Planning & Simulation Twin
Engineer Your Future Warehouse, Virtually
Core Concept
This is where your warehouse becomes a strategic advantage. Your Digital Twin evolves into a perfect virtual replica of your facility and its processes, fed by your actual, real-world operational data. It becomes a risk-free sandbox to test any change—from a new racking layout to a completely different picking strategy—before disrupting the floor.
Real-World Scenario
The Problem: You’re preparing for a 40% surge during peak season. How many temps do you need? Invest in more pallet jacks?
The Solution: Using the Simulation Twin, you model the impact of the surge on your current operation. You then test various strategies: implementing a wave picking process, creating a forward-pick zone for high-velocity items, and changing the slotting for seasonal SKUs. The simulation proves that a dynamic forward-pick zone can handle the surge with only a 15% increase in labor, saving six figures in seasonal hiring costs.
Model seasonal surges and optimize resource allocation
Test new racking configurations and slotting strategies
Reduce labor costs through optimized workflows and automation
Test new fulfillment strategies before implementation
Ready to Transform Your Logistics?
From real-time visibility to predictive intelligence, accelerate fulfillment with RTLS Digital Twins.
Explore Real-Time Digital Twin in LogisticsRTLS Digital Twin Implementation Framework
Comprehensive six-phase methodology for successful deployment and sustained value realization
Core Implementation Principles
- Risk-first implementation strategy with comprehensive mitigation planning
- Continuous stakeholder engagement and transparent communication
- Iterative validation and refinement based on real-world feedback
- Change management integration throughout all phases
- Data-driven decision making with measurable success criteria
- Scalable architecture design for future growth and expansion
Critical Success Factors
- Executive sponsorship with clear vision and committed resources
- Cross-functional implementation team with diverse expertise
- Comprehensive site survey and environmental analysis
- Robust integration architecture with API-first design
- User-centric design with extensive training and support
- Continuous performance monitoring and optimization
Strategic Assessment & Use Case Definition
Comprehensive current state analysis and location intelligence audit with strategic use case prioritization and ROI projections
Key Activities
- Operational workflow analysis and pain point identification
- Asset tracking requirements assessment and gap analysis
- Stakeholder interviews and cross-functional needs analysis
- Use case prioritization matrix development with ROI weighting
- Business case creation with 3-year financial projections
- Technology readiness assessment and infrastructure audit
- Competitive analysis and market positioning evaluation
Key Deliverables
- Current state assessment report with detailed findings
- Prioritized use case roadmap with implementation sequence
- Success metrics framework with KPI definitions
- Business case and ROI projections with sensitivity analysis
- Stakeholder engagement plan and communication strategy
- Risk assessment matrix with mitigation strategies
Critical Success Factor
Executive alignment on strategic objectives, clear success metrics, and committed budget allocation
Architecture Design & Technology Selection
Comprehensive environmental site survey and RF propagation analysis with scalable integration architecture design
Key Activities
- RF site survey and propagation modeling with heat mapping
- Technology stack evaluation including UWB, BLE, WiFi, and hybrid approaches
- Integration architecture design with API specifications
- Security framework development with zero-trust principles
- Scalability planning and future-proofing assessment
- Data governance framework establishment
- Performance benchmarking and SLA definition
- Vendor evaluation and technology partner selection
Key Deliverables
- Detailed site survey report with RF propagation models
- Technology selection rationale with comparative analysis
- System architecture blueprint with integration points
- Security architecture with compliance framework
- API specifications and data flow diagrams
- Scalability roadmap with capacity planning
- Vendor selection report with contract recommendations
Critical Success Factor
Robust, scalable architecture that integrates seamlessly with existing systems and supports future growth
Key Considerations
- Consider multi-technology approach for optimal coverage and redundancy
- Design for interoperability with existing enterprise systems
- Plan for data sovereignty and regulatory compliance requirements
- Ensure architecture supports real-time and batch processing needs
Common Pitfalls to Avoid
- Over-engineering the initial solution
- Insufficient consideration of environmental factors
- Inadequate security planning from the outset
Pilot Implementation & Validation
Controlled pilot deployment with Digital Twin integration and comprehensive performance validation
Key Activities
- Infrastructure deployment in controlled pilot environment
- Digital Twin model development with physical-based simulation
- System integration testing with existing enterprise systems
- User acceptance testing with representative user groups
- Performance benchmarking against defined KPIs
- Data quality validation and accuracy assessment
- User experience optimization and interface refinement
- Operational procedures development and documentation
Key Deliverables
- Functional pilot system with full feature set
- Performance validation report with benchmark metrics
- User feedback analysis with improvement recommendations
- Data quality assessment with accuracy metrics
- Operational procedures documentation
- Training materials and user guides
- Optimization recommendations for full deployment
Critical Success Factor
Proven system performance exceeding baseline metrics and positive user adoption in controlled environment
Key Considerations
- Specify clear scope and expected outcomes of broader operational environment
- Establish clear success criteria before pilot begins
- Involve end-user stakeholders throughout pilot process
- Document all lessons learned for full deployment
Common Pitfalls to Avoid
- Choosing non-representative pilot environment
- Inadequate training and user support
- Insufficient performance monitoring during pilot
Scale-Up Planning & Preparation
Enterprise scaling strategy development with comprehensive resource planning and change management preparation
Key Activities
- Enterprise scaling strategy development with phased approach
- Resource allocation planning including personnel and budget
- Change management program design with communication strategy
- Training curriculum development for different user roles
- Support structure establishment with help desk and escalation procedures
- Performance monitoring framework setup
- Risk mitigation planning with contingency procedures
- Success metrics refinement based on pilot results
Key Deliverables
- Enterprise scaling strategy with detailed timelines
- Resource allocation plan with budget breakdown
- Change management framework with communication plan
- Comprehensive training materials and certification programs
- Support structure documentation with escalation procedures
- Performance monitoring dashboard specifications
- Risk mitigation plan with contingency procedures
Critical Success Factor
Comprehensive preparation ensuring smooth enterprise-wide deployment with minimal business disruption
Key Considerations
- Plan for gradual rollout to minimize operational risk
- Establish clear communication channels for all stakeholders
- Prepare for increased support requirements during initial rollout
- Create feedback loops for continuous improvement
Common Pitfalls to Avoid
- Underestimating training and support requirements
- Ineffective change management preparation
- Inadequate resource allocation for full deployment
Enterprise Deployment & Integration
Phased infrastructure rollout with business process integration and comprehensive workflow automation
Key Activities
- Phased infrastructure deployment across enterprise locations
- Business process integration with workflow automation
- User training and onboarding with role-specific programs
- Performance monitoring and optimization
- Data migration and historical data integration
- Third-party system integration and API connections
- Compliance validation and audit preparation
- Go-live support and stabilization activities
Key Deliverables
- Enterprise-wide infrastructure with full coverage
- Integrated business processes with automated workflows
- Trained and certified user base across all roles
- Performance monitoring dashboard with real-time metrics
- Integrated data ecosystem with historical context
- Compliance documentation and audit reports
- Go-live support documentation and procedures
Critical Success Factor
Seamless integration with existing operations, high user adoption rates, and measurable business impact
Key Considerations
- Maintain business continuity throughout deployment
- Monitor performance closely during post-go-live period
- Provide continuous user training and support as needed
- Continuously analyze data to maintain relevance and engagement
Common Pitfalls to Avoid
- Rushing deployment without adequate testing
- Insufficient go-live support and user assistance
- Poor communication during transition periods
Optimization & Continuous Improvement
Continuous performance analytics and improvement identification with strategic use case expansion planning
Key Activities
- Performance analytics and KPI monitoring with trend analysis
- Continuous optimization initiatives based on data insights
- Use case expansion planning with ROI evaluation framework
- Best practice documentation and knowledge sharing
- Innovation roadmap development with emerging technology assessment
- User feedback collection and system enhancement
- Advanced analytics implementation with AI/ML capabilities
- Strategic planning for next-generation capabilities
Key Deliverables
- Performance analytics dashboard with predictive insights
- Continuous optimization recommendations and implementation
- Expanded use case implementations with measured ROI
- Best practice documentation and training updates
- Innovation roadmap with technology evolution plan
- Advanced analytics capabilities with AI/ML integration
- Strategic plan for next-generation digital twin capabilities
Critical Success Factor
Sustained value realization, continuous innovation culture, and strategic competitive advantage
Key Considerations
- Establish regular review cycles for performance and optimization
- Maintain focus on business value and ROI measurement
- Foster culture of continuous improvement and innovation
- Stay current with emerging technologies and industry trends
Common Pitfalls to Avoid
- Treating implementation as one-time project rather than ongoing journey
- Insufficient investment in continuous improvement
- Losing focus on business outcomes and user needs
Risk Mitigation and Contingency Planning
Technical Risks
RF Interference Issues
Impact: High Probability: MediumMitigation: Comprehensive site survey, multi-technology approach with UWB, BLE, WiFi redundancy, adaptive algorithms
Contingency: Alternative technology deployment, phased rollout
Integration Complexity
Impact: High Probability: MediumMitigation: API-first design, extensive integration testing
Contingency: Simplified staging, dedicated integration team
Scalability Limitations
Impact: Medium Probability: LowMitigation: Cloud-native architecture, modular system
Contingency: Infrastructure scaling, performance optimization
Data Quality Issues
Impact: High Probability: MediumMitigation: Validation framework, real-time monitoring
Contingency: Sensor deployment, quality improvement initiatives
Operational Risks
User Adoption Challenges
Impact: High Probability: MediumMitigation: Training programs, change champions, feedback integration
Contingency: Incentive programs, additional support resources
Performance Expectations Gap
Impact: Medium Probability: MediumMitigation: Clear KPIs, continuous optimization
Contingency: Adjustment of scope, stakeholder engagement
Budget Overruns
Impact: High Probability: LowMitigation: Detailed cost planning, phased rollout
Contingency: Scope reduction, additional budget approval
Timeline Delays
Impact: Medium Probability: MediumMitigation: Realistic milestone planning, resource reallocation
Contingency: Parallel work streams, extended timelines
Typical Implementation Timeline & Milestones
Foundation Phase
- Stakeholder alignment
- Architecture design completion
- Pilot deployment success
Deployment Phase
- Enterprise-wide deployment
- System integration complete
- User training completion
Optimization Phase
- 100% coverage achieved
- Advanced analytics deployment
- Continuous improvement cycle
RTLS Digital Twin Implementation Guide
Explore RTLS + Digital Twin ImplementationROI Calculation Framework for RTLS Digital Twins
Comprehensive methodology for quantifying value creation across operational, strategic, and transformational dimensions
Three-Dimensional Value Creation Model
Operational Value
- Labor productivity improvement: 15–35%
- Asset utilization optimization: 20–40%
- Search time elimination: 80–95%
- Operational overhead reduction: 10–25%
- Quality defect reduction: 30–60%
Strategic Value
- Process optimization insights
- Predictive maintenance capabilities
- Data-driven decision making
- Customer satisfaction improvement
- Regulatory compliance automation
Transformational Value
- New revenue stream creation
- Market differentiation capabilities
- Innovation platform foundation
- Ecosystem partnership opportunities
- Future-ready infrastructure
ROI Calculation Components
Cost Reduction Categories
Revenue Enhancement Opportunities
Ready to Calculate Your ROI?
Get a personalized ROI analysis based on your specific operational requirements
Calculate your Digital Twin ROIComprehensive ROI Calculation Methodology
ROI = (Total Benefits - Total Costs - Opportunity Costs) / (Total Costs + Opportunity Costs) × 100%
Opportunity Cost Components
- Delayed efficiency gains: $50K–200K per quarter
- Competitive disadvantage: 5–15% market share risk
- Technology debt accumulation: $25K–100K annually
- Regulatory compliance gaps: $10K–500K potential penalties
Step 1: Quantify Total Costs (per 100K sqft)
Step 2: Calculate Total Benefits
Typical payback for visibility-focused implementations
Advanced analytics and optimization features
Full autonomous optimization systems
Ready to Calculate Your ROI?
Get a personalized ROI analysis based on your specific operational requirements
Calculate your Digital Twin ROIIndustry ROI Benchmarks & Case Studies
Manufacturing
150–250%
3-Year ROI Range
18–24 months
Payback Period
- Tool tracking
- WIP optimization
- Quality control
- Maintenance scheduling
Boeing reduced tool search time by 90% across 17 facilities, saving $2.1M annually with 22-month payback
(Source: Industry Week, 2023)
Healthcare
200–400%
3-Year ROI Range
9–18 months
Payback Period
- Asset tracking
- Patient flow
- Staff optimization
- Compliance monitoring
Mayo Clinic achieved $1.8M annual savings through 85% reduction in equipment search time and 40% improvement in asset utilization
(Source: HFMA, 2023)
Logistics
180–350%
3-Year ROI Range
12–24 months
Payback Period
- Inventory tracking
- Route optimization
- Throughput improvement
- Loss prevention
DHL increased warehouse throughput 28% while reducing labor costs 15% and inventory shrinkage 75%
(Source: SCMR, 2023)
ROI Progression Timeline
Quick Wins
- Asset visibility: 90%+
- Search time reduction: 80%
- Initial ROI: 25–50%
Process Optimization
- Workflow efficiency: +30%
- Quality improvements: +40%
- Cumulative ROI: 75–150%
Advanced Analytics
- Predictive insights
- Autonomous optimization
- Cumulative ROI: 150–250%
Strategic Value
- New revenue streams
- Market differentiation
- Total ROI: 200–400%
Ready to Calculate Your ROI?
Get a personalized ROI analysis based on your specific operational requirements
Calculate your Digital Twin ROIInteractive ROI Calculator
Operational Inputs
Projected Results
Calculation Breakdown
- Search Time Savings: $625,000
- Pallet Handling Savings: $625,000
- WIP Reduction: $1,875,000
- Asset Utilization Gain: $125,000
- Quality Savings: $1,250,000
- Maintenance Savings: $10,000
Ready to Calculate Your ROI?
Get a personalized ROI analysis based on your specific operational requirements
Calculate your Digital Twin ROIOvercoming RTLS Digital Twin Integration Challenges
Practical solutions to common implementation obstacles based on 100+ deployments
Primary failure factors: Integration complexity (34%), Change management (28%), Unrealistic expectations (21%), Technical issues (17%)
Data Synchronization and Latency Management
RTLS updates 10x/second, ERP updates hourly – creating coherent real-time view is complex.
Impact: Total stack latency often 500ms–2s. AGVs at 2m/s move 4 meters during delay → collision warnings arrive too late.
Deploy three-tier processing: Edge (<100ms) for position calculation and collision detection, Fog (100ms-1s) for area coordination, Cloud (1s+) for analytics and BI.
Implementation Approach:
- Deploy edge nodes every 100–200 meters with local processing
- Implement NTP/PTP for microsecond-level synchronization
- Use message queues (MQTT, Kafka) for async processing
- Apply QoS policies ensuring data takes precedence
- Implement local buffering during connectivity issues
Automotive manufacturer reduced collision warning latency from 1.8s to 120ms, preventing 3 near-miss incidents in first month.
Results: Latency reduction 93%, Critical alert response <100ms, System availability 99.9%
Accuracy Degradation in Industrial Environments
Metal structures and EMI significantly impact accuracy.
Impact: Open space: ±10–30cm → Near metal: ±50–150cm → Between racks: ±100–300cm → Signal loss zones.
Combine UWB, BLE, IMU, and computer vision with Kalman/Particle filters. Use ML to learn environment-specific error patterns and predict interference periods.
Implementation Approach:
- Deploy hybrid positioning (UWB + BLE/IMU)
- Implement Extended Kalman Filter for fusion
- Use ML models for interference prediction
- Overlapping coverage with N+1 redundancy
- Map-constrained positioning algorithms
Steel mill achieved 95% position availability with ±1cm accuracy despite heavy EMI.
Results: Accuracy +75%, Dead zone elimination 90%
Enterprise System Integration Complexity
Modern facilities run 15-50 different software systems with diverse protocols, data models, and integration patterns
Impact: Protocol diversity (REST, SOAP, OPC-UA, proprietary), data model mismatches, conflicting ID schemes create integration maze
Implement enterprise service bus with protocol translation, data transformation, and master data management. Use event-driven architecture for loose coupling.
Implementation Approach:
- Deploy API gateway with authentication and rate limiting
- Implement adapter layer for each target system
- Use master data management for ID correlation
- Apply event-driven integration patterns
- Implement federated queries for real-time aggregation
Manufacturing facility integrated 23 systems in 8 weeks vs. typical 6-month timeline using unified integration platform
Results: Integration time: 80% reduction, Data consistency: 99.5%, System coupling: Reduced by 70%
Scalability and Performance Bottlenecks
1,000 assets × 10 updates/second = 864M records/day. Historical data accumulates at 1TB/month with exponential computational demands
Impact: System performance degrades significantly beyond 1,000 tracked assets. Real-time processing becomes impossible at scale
Containerized microservices with Kubernetes orchestration, horizontal scaling, distributed caching, and GPU acceleration for physics simulation.
Implementation Approach:
- Containerize services using Docker/Kubernetes
- Implement horizontal pod autoscaling policies
- Deploy distributed caching (Redis Cluster)
- Use service mesh (Istio) for traffic management
- Implement tiered storage (hot/warm/cold data)
Logistics provider scaled from 100 to 5,000 assets maintaining sub-200ms response times at 50,000 updates/second
Results: Scalability: 50x improvement, Response time: <100ms at scale, Cost efficiency: 60% reduction
Organizational Implementation Challenges
People, process, and cultural transformation obstacles
Change Management and User Adoption
Key Statistics: 78% cite privacy concerns, 94% adoption rate achievable with proper approach
Challenge DetailsBusiness Impact: Poor adoption leads to system underutilization, resistance to process changes, incomplete data collection
- Executive sponsorship from operations leadership
- Union/worker council early engagement and collaboration
- Privacy framework with anonymous tracking where possible
- Champion program with operational and power user tiers
- Multi-modal training (hands-on, video, mobile guides)
Healthcare system achieved 94% adoption by involving nurses in design, implementing privacy protections, focusing on 'time-saving' messaging
Timeline: 3-6 months for full organizational adoption
Data Privacy and Security Requirements
Key Statistics: Regulatory violations average $4M+ annually, GDPR fines up to 4% of revenue
Challenge DetailsBusiness Impact: Legal liability, regulatory fines, worker trust erosion, operational restrictions
- End-to-end encryption (AES-256) for all data transmission
- Role-based access control with multi-factor authentication
- Comprehensive audit logging and compliance monitoring
- Data minimization and automatic expiration policies
- Regular security assessments and penetration testing
Manufacturing facility implemented zero-trust architecture, passed GDPR audit with zero findings, reduced security incidents by 85%
Timeline: 2-4 months for full security implementation
Managing Expectations and Demonstrating ROI
Key Statistics: 60% struggle to quantify value, unrealistic expectations cause 21% of project failures
Challenge DetailsBusiness Impact: Stakeholder disappointment, budget cuts, project cancellation, reduced future investment
- Baseline establishment with time-motion studies
- KPI definition matrix across visibility/control/optimization levels
- Monthly value assessments with executive reporting
- Quick wins identification (months 1-3)
- Long-term transformation roadmap (months 10-18)
Logistics provider demonstrated 15% efficiency gains in month 2, achieved full ROI in 16 months vs. projected 24 months
Timeline: Ongoing with monthly value assessments
Environmental and Operational Challenges
Physical deployment and maintenance obstacles
Asset Tag Management at Scale
Managing thousands of tags becomes significant operational undertaking
Common Problems- Battery replacement scheduling for 5,000+ tags
- Firmware updates across distributed infrastructure
- Tag-asset association maintenance
- Damage/loss tracking and replacement
- Performance monitoring and optimization
- Automated registration and asset association
- Predictive battery replacement algorithms
- Over-the-air firmware update capability
- Real-time performance monitoring dashboards
- Automated spare inventory management (10-15% buffer)
Operational overhead reduction: 60%, Tag uptime: 99.5%, Maintenance cost reduction: 40%
RF Site Design and Optimization
Achieving reliable RTLS coverage requires careful RF engineering in complex industrial environments
Common Problems- Multipath interference from metal structures
- Dynamic environmental conditions affecting signal
- Optimal anchor placement for coverage and accuracy
- Interference from industrial equipment
- Ongoing optimization as facility layout changes
- Comprehensive RF site survey (predictive + active + passive)
- Anchor placement optimization (4-8m height, N+1 coverage)
- Quarterly coverage audits and dead zone detection
- Dynamic power adjustment and interference mitigation
- Automated anchor health monitoring and alerting
Coverage reliability: 99%+, Accuracy consistency: ±20% variation, Maintenance calls: 70% reduction
Building Resilient RTLS Digital Twins
Success patterns from 100+ implementations
Success Pattern Recognition
- Start Small, Think Big
Pilot with single use case, build confidence, expand based on proven value - Invest in Foundation
Robust infrastructure, comprehensive integration, strong security framework - Focus on Adoption
User-centric design, comprehensive training, continuous support - Measure and Iterate
Clear baselines, regular ROI assessment, continuous optimization
Implementation Timeline
- Foundation (4–6 weeks) – Assessment, architecture design, stakeholder alignment
- Infrastructure (6–8 weeks) – Hardware deployment, network setup, initial integration
- Development (8–10 weeks) – Digital twin modeling, analytics, enterprise integration
- Pilot (4–6 weeks) – Limited deployment, user training, performance testing
- Rollout (8–12 weeks) – Full deployment, change management, optimization
- Optimization (Ongoing) – Performance monitoring, ROI measurement, scaling
Technical Excellence
- Robust architecture design and validation
- Comprehensive testing at each phase
- Performance monitoring and optimization
- Security and compliance adherence
Organizational Readiness
- Strong executive sponsorship
- Dedicated project team and resources
- Comprehensive change management
- Continuous stakeholder engagement
Operational Excellence
- Clear KPIs and success metrics
- Regular value assessment and reporting
- Continuous improvement processes
- Scaling and expansion planning
Key Takeaway
Every challenge in RTLS Digital Twin implementation represents an opportunity for competitive advantage. Organizations that successfully navigate these challenges don’t just implement technology—they transform their operations, culture, and competitive position. The key is approaching implementation with realistic expectations, comprehensive planning, and commitment to continuous improvement.
German Automotive OEM - Tool Management Excellence
Executive Summary
A major German automotive manufacturer operating one of Europe’s largest production facilities implemented RTLS Digital Twin technology to address critical tool management challenges across their 2-million-square-foot operation with 15,000+ specialized tools in circulation across 8 production lines.
Business Challenge
15,000+ specialized tools across 2M sq ft facility with critical tool loss and quality issues from uncalibrated tools affecting 200+ vehicles per shift production.
RTLS Solution
Ultra-Wideband (UWB) infrastructure with 10–30cm accuracy integrated with Manufacturing Execution System (MES) and digital twin platform for real-time visualization.
Key Results Achieved
38min → 2min
73% reduction
€1.2–1.8M
"The integration transformed our production floor from reactive to predictive operations with unprecedented tool accountability."
Implementation Timeline
14 months total (12-week pilot, 18-month phased expansion)
Technology Stack
- Ultra-Wideband (UWB) infrastructure providing 10–30cm accuracy
- Integration with existing Manufacturing Execution System (MES)
- Digital twin platform for real-time visualization
- Predictive analytics for tool maintenance scheduling
- Mobile applications for production workers
Implementation Approach
- 12-week pilot deployment in single production hall
- Comprehensive tool tagging and calibration baseline
- MES integration and workflow optimization
- Phased expansion across remaining 7 production lines
- Integration with quality management systems
- Mobile application rollout and worker training
Implementation Challenges & Solutions
RF interference in metal-heavy manufacturing environment affecting signal accuracy
Solution:Deployed mesh networking with redundant anchor points and advanced signal processing algorithms
Integration complexity with legacy MES systems and multiple production line configurations
Solution:API-first architecture with custom middleware for seamless data flow and real-time synchronization
Worker adoption and change management across multiple shifts and languages
Solution:Comprehensive training program with multilingual mobile interfaces and champion user network
Operational Improvements
- Tool Search Time 95% reduction
From average 38 minutes to under 2 minutes per search incident - Production Line Stoppages 73% reduction
Dramatic decrease in production delays due to missing tools - Tool Inventory Requirements 22% reduction
Better utilization eliminated need for excess tool inventory - Quality Incidents Near-zero
Eliminated quality issues from uncalibrated tools
Financial Impact
- Payback Period 14 months
Based on ARC Advisory Group automotive benchmarks - Annual Savings €1.2–1.8M
Combination of productivity gains and inventory optimization - Productivity Improvement 12–18%
Overall production efficiency gains across all lines
Key Lessons Learned
- Phased deployment approach critical for managing complexity and ensuring adoption
- Integration with existing MES systems provides exponential value beyond standalone RTLS
- Mobile worker interfaces essential for real-time feedback and system effectiveness
- Predictive maintenance capabilities emerged as unexpected high-value use case
- Quality system integration provides compliance benefits beyond operational efficiency
Industry Applicability
This implementation demonstrates proven patterns that can be adapted across similar manufacturing environments and related industries.
Transferable Success Factors:
- Phased implementation approach
- Strong executive sponsorship
- Integration-first architecture
- Continuous improvement methodology
Critical Considerations:
- Change management investment
- Infrastructure readiness assessment
- Baseline metrics establishment
- Vendor ecosystem alignment
Top-5 US Health System - Equipment & Patient Flow
Executive Summary
A major US academic medical center with 800+ beds implemented hybrid RTLS technology to address critical equipment availability and patient throughput challenges, with nurses spending 21% of shift time searching for equipment and emergency department length-of-stay averaging 5.2 hours.
Business Challenge
800+ bed facility with nurses spending 21% of shift time searching for equipment, $2.8M annual rental costs, and 5.2-hour average ED length-of-stay
RTLS Solution
Hybrid BLE beacons and Wi-Fi-based RTLS leveraging existing infrastructure with EHR integration and command center platform for patient flow management
Key Results Achieved
83% reduction
21% reduction
$1.4M
"We achieved unprecedented visibility into our operations with measurable patient outcomes and significant cost savings."
Implementation Timeline
16 months total (8-week equipment pilot, 44-week full deployment)
Technology Stack
- BLE beacons for cost-effective equipment tracking
- Wi-Fi-based RTLS leveraging existing infrastructure
- Integration with Electronic Health Record (EHR) system
- Command center platform for patient flow management
- Mobile applications for clinical staff
Implementation Approach
- Phase 1: High-value equipment tracking (IV pumps, monitors) - 8 weeks
- Phase 2: All mobile medical equipment expansion - 16 weeks
- Phase 3: Patient tracking and flow optimization - 20 weeks
- EHR integration and workflow optimization
- Command center deployment and staff training
- Continuous improvement and optimization
Implementation Challenges & Solutions
Complex hospital environment with RF interference and varying infrastructure quality
Solution:Hybrid approach combining BLE and Wi-Fi technologies with adaptive signal processing
Integration with multiple clinical systems and EHR platforms
Solution:HL7 FHIR-compliant API architecture for seamless data exchange
Clinical workflow disruption and staff adoption concerns
Solution:Phased rollout with clinical champion program and workflow optimization
Operational Improvements
- Equipment Search Time 83% reduction
Aligned with HIMSS Analytics benchmarks of 75-85% improvement - Equipment Utilization Rate 52% increase
Improved from 42% to 64% utilization across all tracked assets - ED Length-of-Stay 21% reduction
Decreased from 5.2 to 4.1 hours average - Bed Turnover Time 27 minutes faster
Significant improvement in patient flow efficiency
Financial Impact
- Equipment Rental Reduction $950,000
34% decrease in annual rental costs - PAR Level Optimization 28% reduction
Inventory optimization through better utilization - Ongoing Operational Savings $1.4M annually
Combined efficiency and cost reduction benefits - 3-Year ROI 180-220%
Based on healthcare industry standards
Key Lessons Learned
- Hybrid technology approach provides optimal balance of cost and performance
- EHR integration essential for clinical workflow adoption and value realization
- Patient flow optimization provides greater ROI than equipment tracking alone
- Clinical champion program critical for successful adoption across departments
- Real-time dashboards enable proactive rather than reactive management
Industry Applicability
This implementation demonstrates proven patterns that can be adapted across similar healthcare environments and related industries.
Transferable Success Factors:
- Phased implementation approach
- Strong executive sponsorship
- Integration-first architecture
- Continuous improvement methodology
Critical Considerations:
- Change management investment
- Infrastructure readiness assessment
- Baseline metrics establishment
- Vendor ecosystem alignment
Global 3PL Provider - Distribution Center Transformation
Executive Summary
A major third-party logistics provider operating a 500,000 square foot distribution center implemented RTLS Digital Twin technology to scale operations without facility expansion, addressing picking accuracy below client requirements and significant operational inefficiencies.
Business Challenge
500,000 sq ft distribution center with 98.5% picking accuracy (below 99.5% client requirements), capacity limitations, and 45% forklift deadheading
RTLS Solution
UWB-based positioning for forklifts and AGVs integrated with WMS, digital twin for traffic optimization, and machine learning for predictive positioning
Key Results Achieved
99.7%
28%
40% reduction
"Our warehouse now operates like a self-organizing organism with minimal human intervention and maximum efficiency."
Implementation Timeline
18 months total (6-month pilot, 12-month full deployment)
Technology Stack
- UWB-based positioning for forklifts and AGVs
- Integration with Warehouse Management System (WMS)
- Digital twin platform for traffic optimization
- Machine learning algorithms for predictive positioning
- Autonomous coordination systems
Implementation Approach
- Comprehensive site survey and RF propagation analysis
- Pilot deployment in high-traffic zone
- WMS integration and workflow optimization
- Phased expansion across entire facility
- Machine learning model training and optimization
- Autonomous system deployment and testing
Implementation Challenges & Solutions
Complex multi-level facility with varying ceiling heights and metal racking interference
Solution:3D positioning system with adaptive anchor placement and signal processing
Integration with legacy WMS and multiple client-specific requirements
Solution:API-first architecture with configurable business rules engine
Coordinating autonomous systems with human workers safely
Solution:Predictive collision avoidance and dynamic zone management
Operational Improvements
- Picking Accuracy 1.2% increase
Achieved 99.7% from 98.5%, exceeding client requirements - Shipping Accuracy 99.8%
Near-perfect shipping accuracy achieved - Inventory Accuracy 99.6%
Real-time inventory visibility and accuracy - AGV Efficiency 34% increase
Through autonomous coordination and optimization
Financial Impact
- Throughput Increase 28%
- Labor Productivity +22%
- Avoided Facility Expansion $12M saved
- Annual Operational Savings $2.1M
Key Lessons Learned
- 3D positioning critical for multi-level warehouse environments
- Machine learning optimization requires significant data collection period
- Autonomous coordination provides exponential benefits over individual tracking
- Client-specific customization capabilities essential for 3PL environments
- Safety systems must be designed for human-autonomous interaction
Industry Applicability
This implementation demonstrates proven patterns that can be adapted across similar logistics environments and related industries.
Transferable Success Factors:
- Phased implementation approach
- Strong executive sponsorship
- Integration-first architecture
- Continuous improvement methodology
Critical Considerations:
- Change management investment
- Infrastructure readiness assessment
- Baseline metrics establishment
- Vendor ecosystem alignment
European Steel Manufacturer - Safety in Harsh Environments
Executive Summary
A major European steel producer implemented specialized RTLS technology designed for extreme industrial conditions, addressing safety-critical operations in environments with temperatures ranging from -20°C to +1200°C and high electromagnetic interference.
Business Challenge
Extreme environment with -20°C to +1200°C range, high interference, and strict compliance needs
RTLS Solution
Industrial-grade UWB with mesh networking, intrinsically safe certified equipment, edge processing for resilience, and integration with safety systems.
Key Results Achieved
68% reduction
67% faster
71% improvement
"The system provides safety assurance that was impossible with traditional methods in our extreme industrial environment."
Implementation Timeline
20 months total (8-month pilot, 12-month full deployment)
Technology Stack
- Industrial-grade UWB with mesh networking
- Intrinsically safe certified equipment
- Edge processing systems for resilience
- Integration with safety systems
- Hardened enclosures for harsh environments
Implementation Approach
- Comprehensive safety and environmental assessment
- Pilot deployment in controlled production area
- Safety system integration and testing
- Phased expansion to high-risk zones
- Emergency response system integration
- Compliance validation and certification
Implementation Challenges & Solutions
Solution: Hardened equipment with adaptive signal processing & mesh networking
Solution: Certified explosion-proof enclosures & integration with safety systems
Solution: Advanced antenna with redundant mesh networking
Operational Improvements
- Vehicle-Pedestrian Near-Misses 68% reduction
Significant improvement in workplace safety incidents - Emergency Mustering Time 67% faster
Reduced from 12 minutes to 4 minutes average - Safety Compliance Violations 71% decrease
Dramatic improvement in regulatory compliance - Asset Utilization 19% increase
Better equipment tracking and optimization
Financial Impact
- Risk Avoidance Value $3–5M annually
Estimated value of prevented incidents and compliance issues - Productivity Improvement 14%
Overall operational efficiency gains - Maintenance Efficiency 26% improvement
Better scheduling and asset management - ROI Achievement 20 months
Payback period including risk mitigation value
Key Lessons Learned
- Environmental hardening critical for extreme applications
- Safety system integration > standalone tracking
- Mesh networking ensures reliability in RF environments
- Intrinsically safe certification requires expertise
- Risk mitigation often exceeds operational savings
Industry Applicability
Transferable Success Factors:
- Phased implementation approach
- Strong executive sponsorship
- Integration-first architecture
- Continuous improvement methodology
Critical Considerations:
- Change management investment
- Infrastructure readiness assessment
- Baseline metrics establishment
- Vendor ecosystem alignment
Major Aerospace Manufacturer - FOD Prevention & Tool Control
Executive Summary
A Tier-1 aerospace manufacturer implemented ultra-high precision RTLS technology for Foreign Object Debris (FOD) prevention and tool accountability, supporting 5,000+ serialized tools with regulatory requirements for 100% accountability and microsecond-level tracking compliance.
Business Challenge
Regulatory requirement for 100% tool accountability, FOD prevention, and serialized tool tracking with microsecond precision.
RTLS Solution
Ultra-high precision UWB (10cm 3D accuracy), blockchain custody chain, MRO integration, and automated compliance reporting.
Key Results Achieved
89% reduction
Zero in 24 months
75% faster
"We achieved complete tool accountability with zero FOD incidents, exceeding all regulatory requirements while improving operational efficiency."
Implementation Timeline
20 months total (6-month pilot, 14-month full deployment)
Technology Stack
- Ultra-high precision UWB (10cm accuracy)
- Blockchain custody chain
- Integration with MRO systems
- Automated compliance reporting
- Serialized microsecond tool tracking
Implementation Approach
- Compliance assessment & requirement definition
- Pilot deployment in critical assembly
- Blockchain custody implementation
- MRO workflow optimization
- Full facility rollout with compliance validation
- Automated reporting integration
Implementation Challenges & Solutions
Solution: Redundant UWB 3D positioning with 10cm accuracy
Solution: Custom blockchain with smart contracts + MRO integration
Solution: Automated compliance reporting with real-time data
Operational Improvements
- Tool Control Violations 89% reduction
Dramatic improvement in regulatory compliance - FOD Incidents Zero incidents
24 months of zero Foreign Object Debris incidents - Audit Preparation Time 75% reduction
Automated compliance reporting and documentation - Tool Inventory Optimization 31% reduction
Better utilization and accountability
Financial Impact
- Risk Avoidance Value $3–5M annually
Estimated value of prevented FOD incidents and compliance issues - Productivity Improvement 14%
Overall operational efficiency gains - ROI Achievement 20 months
Including risk mitigation and compliance benefits - Compliance Cost Reduction 60%
Automated reporting and documentation savings
Key Lessons Learned
- Ultra-high precision drives technology & approach
- Blockchain ensures immutable compliance docs
- Automated reporting critical for regulatory audits
- Risk mitigation > efficiency in aerospace
- Integration with MRO systems key for adoption
Industry Applicability
Transferable Success Factors:
- Phased implementation approach
- Strong executive sponsorship
- Integration-first architecture
- Continuous improvement methodology
Critical Considerations:
- Change management investment
- Infrastructure readiness assessment
- Baseline metrics establishment
- Vendor ecosystem alignment